
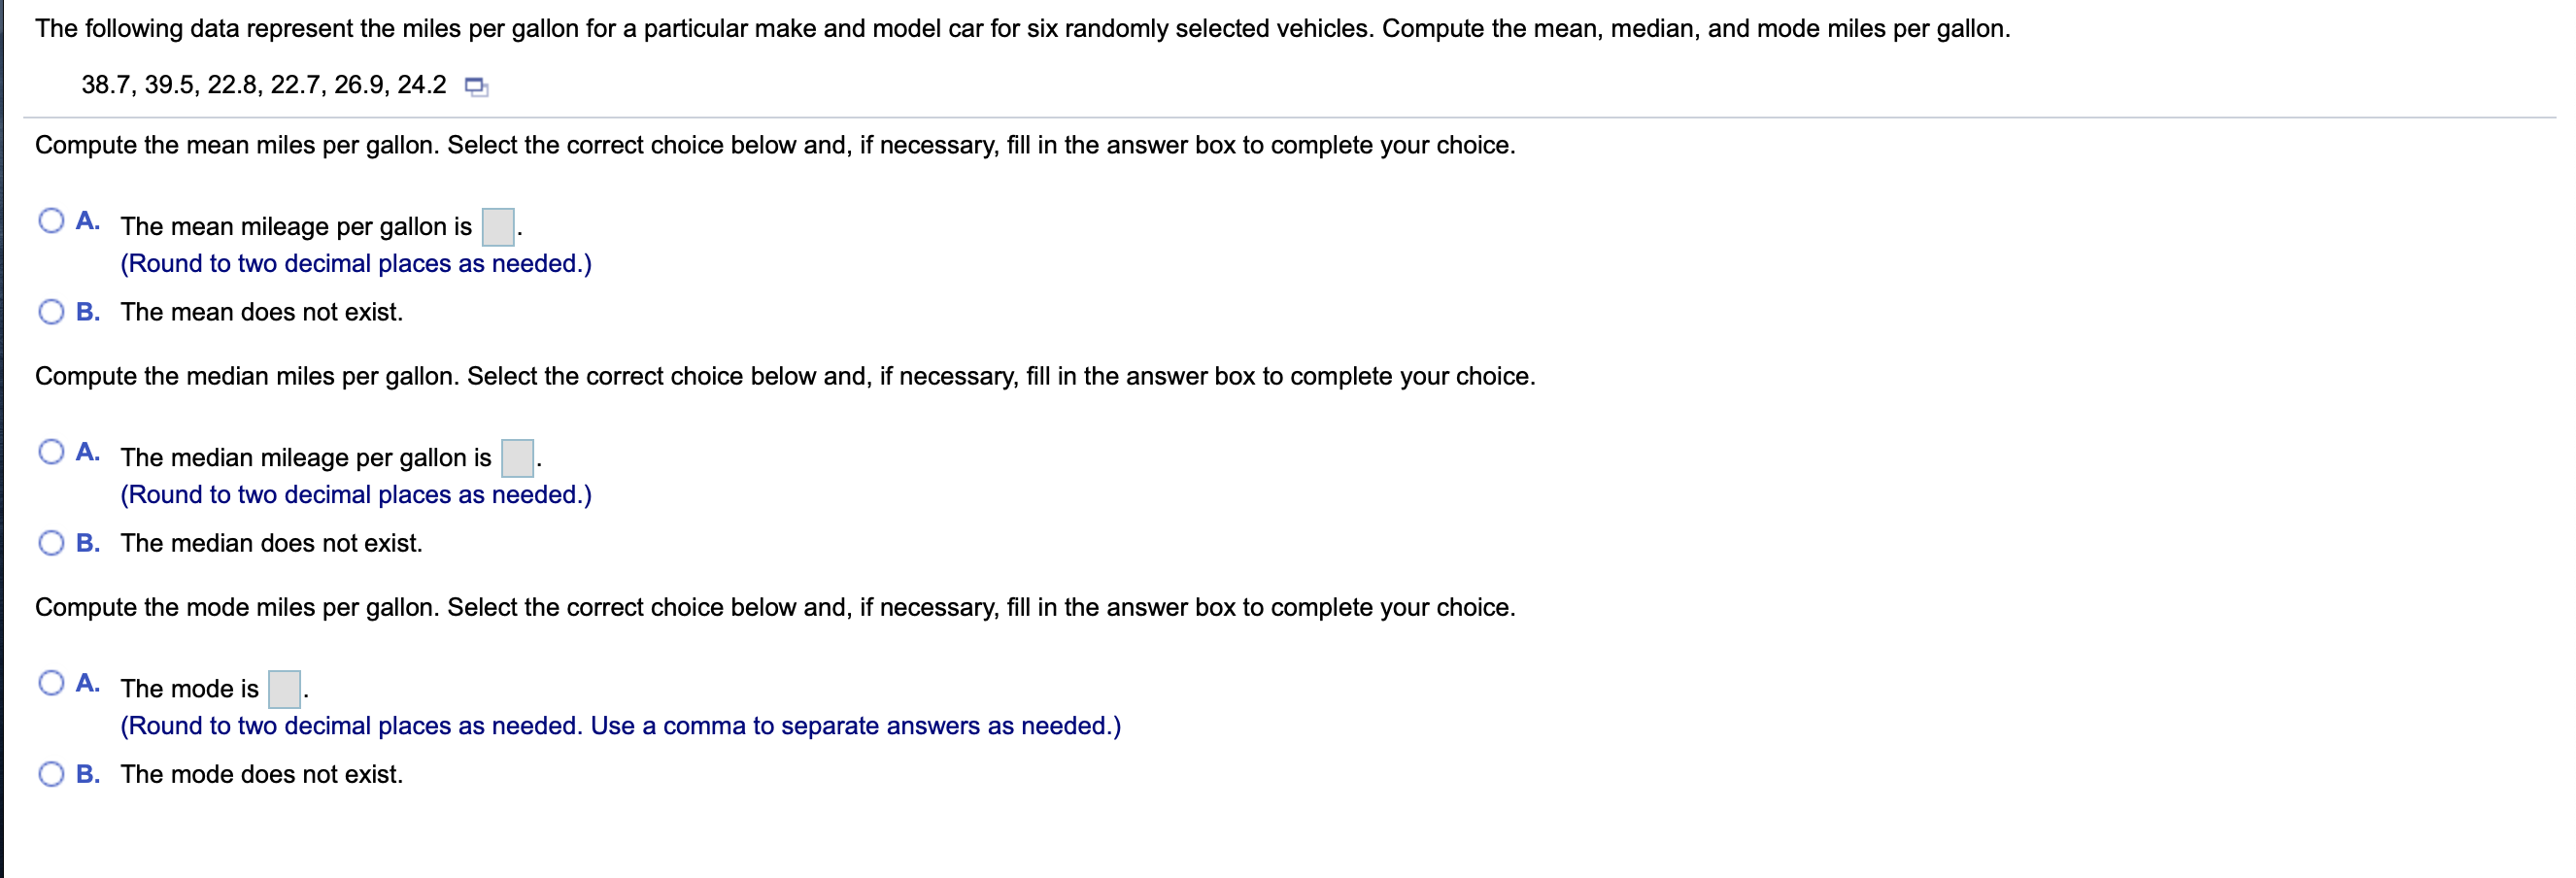
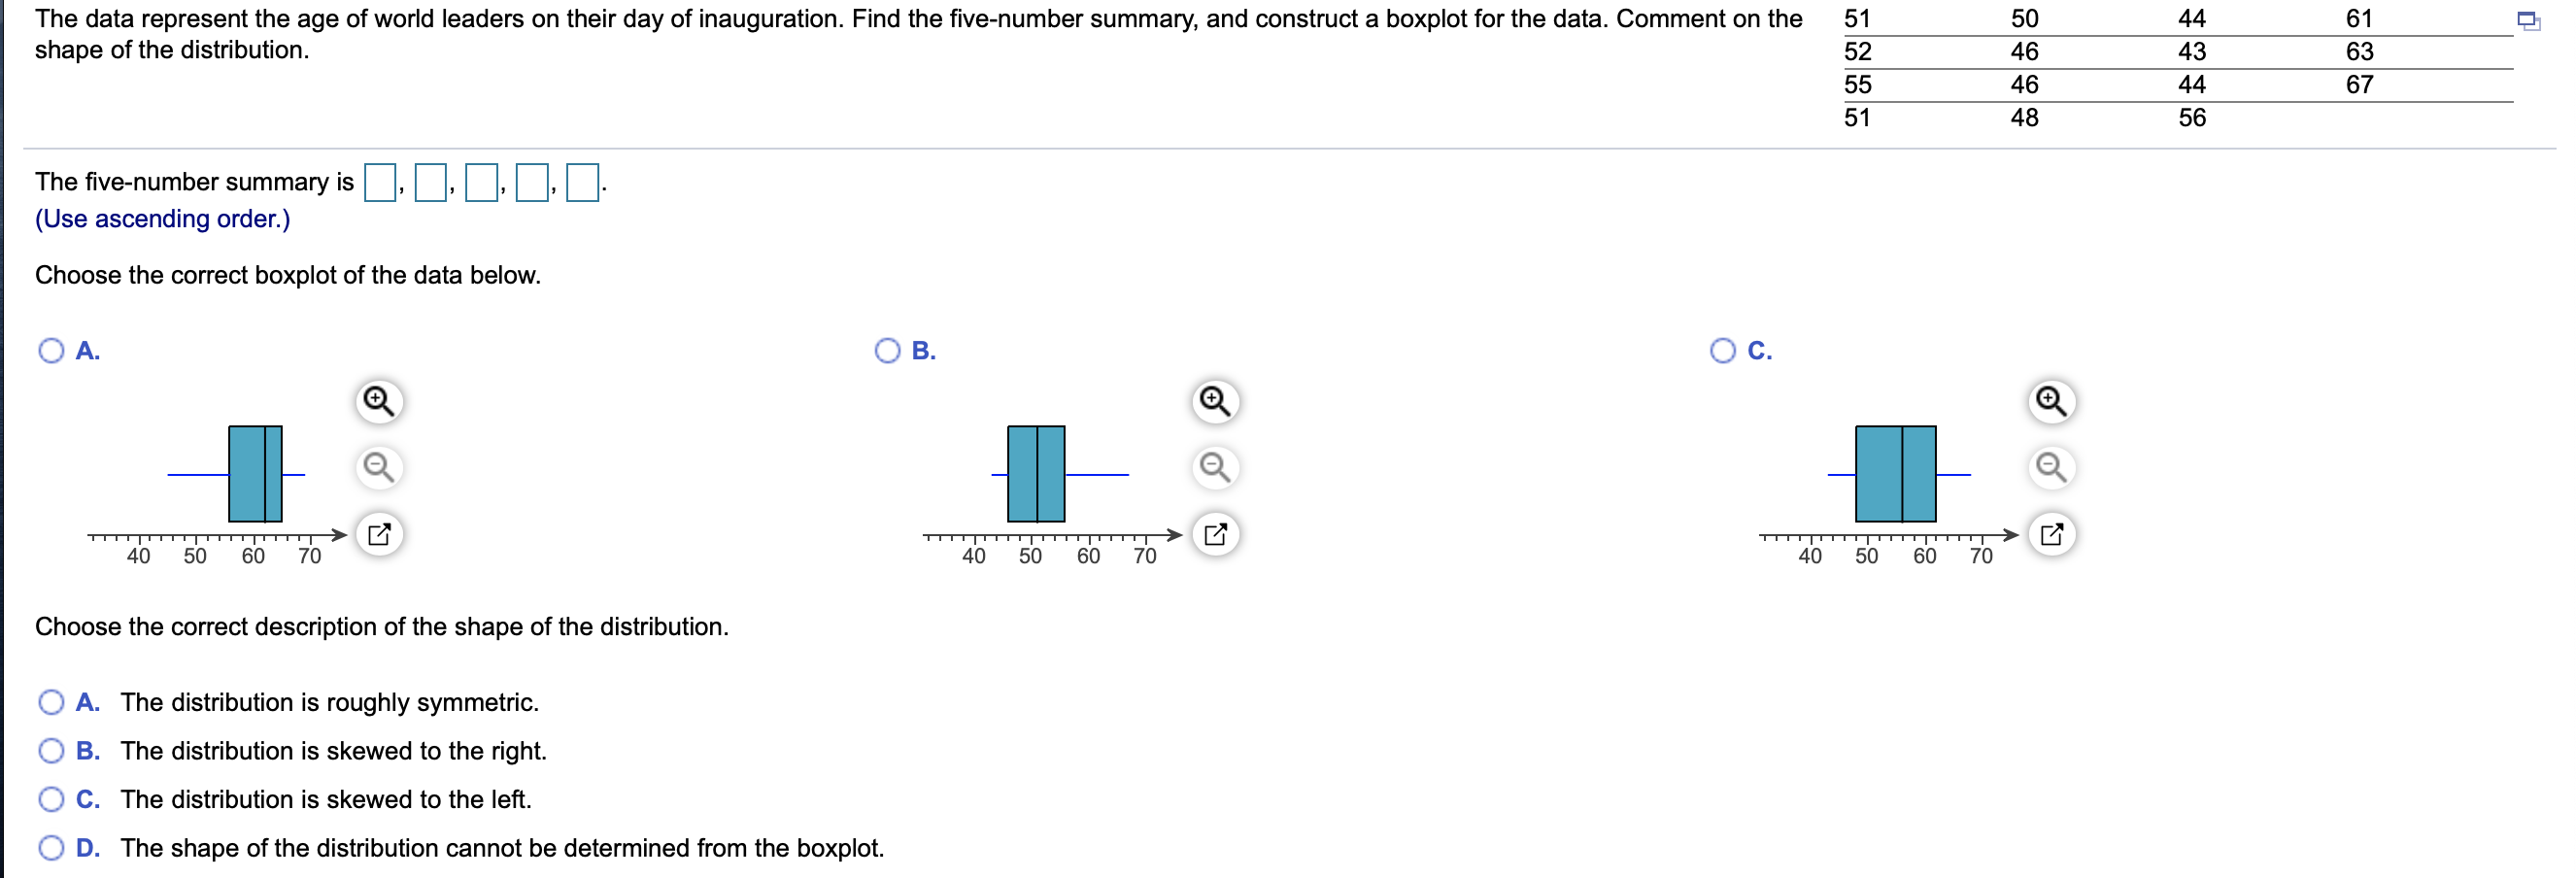
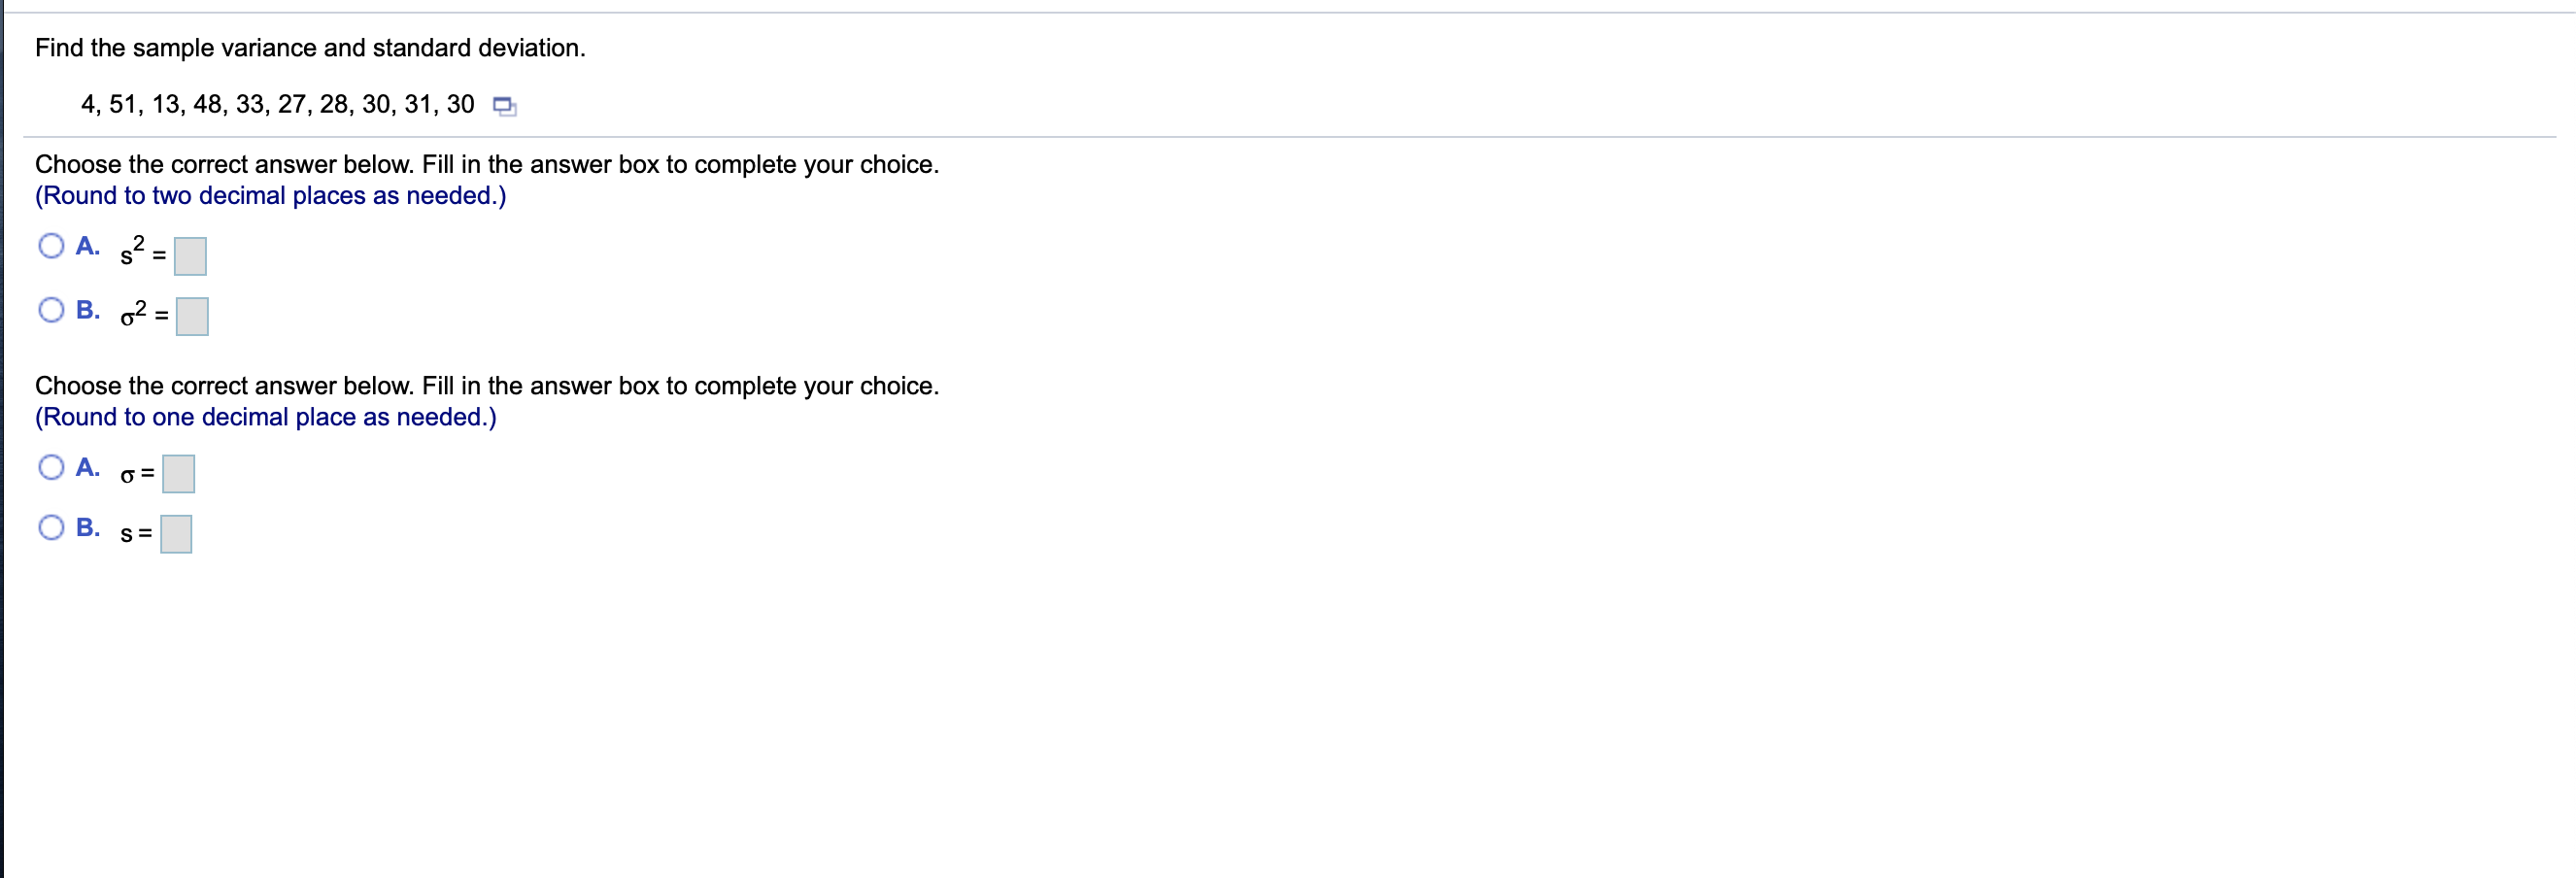
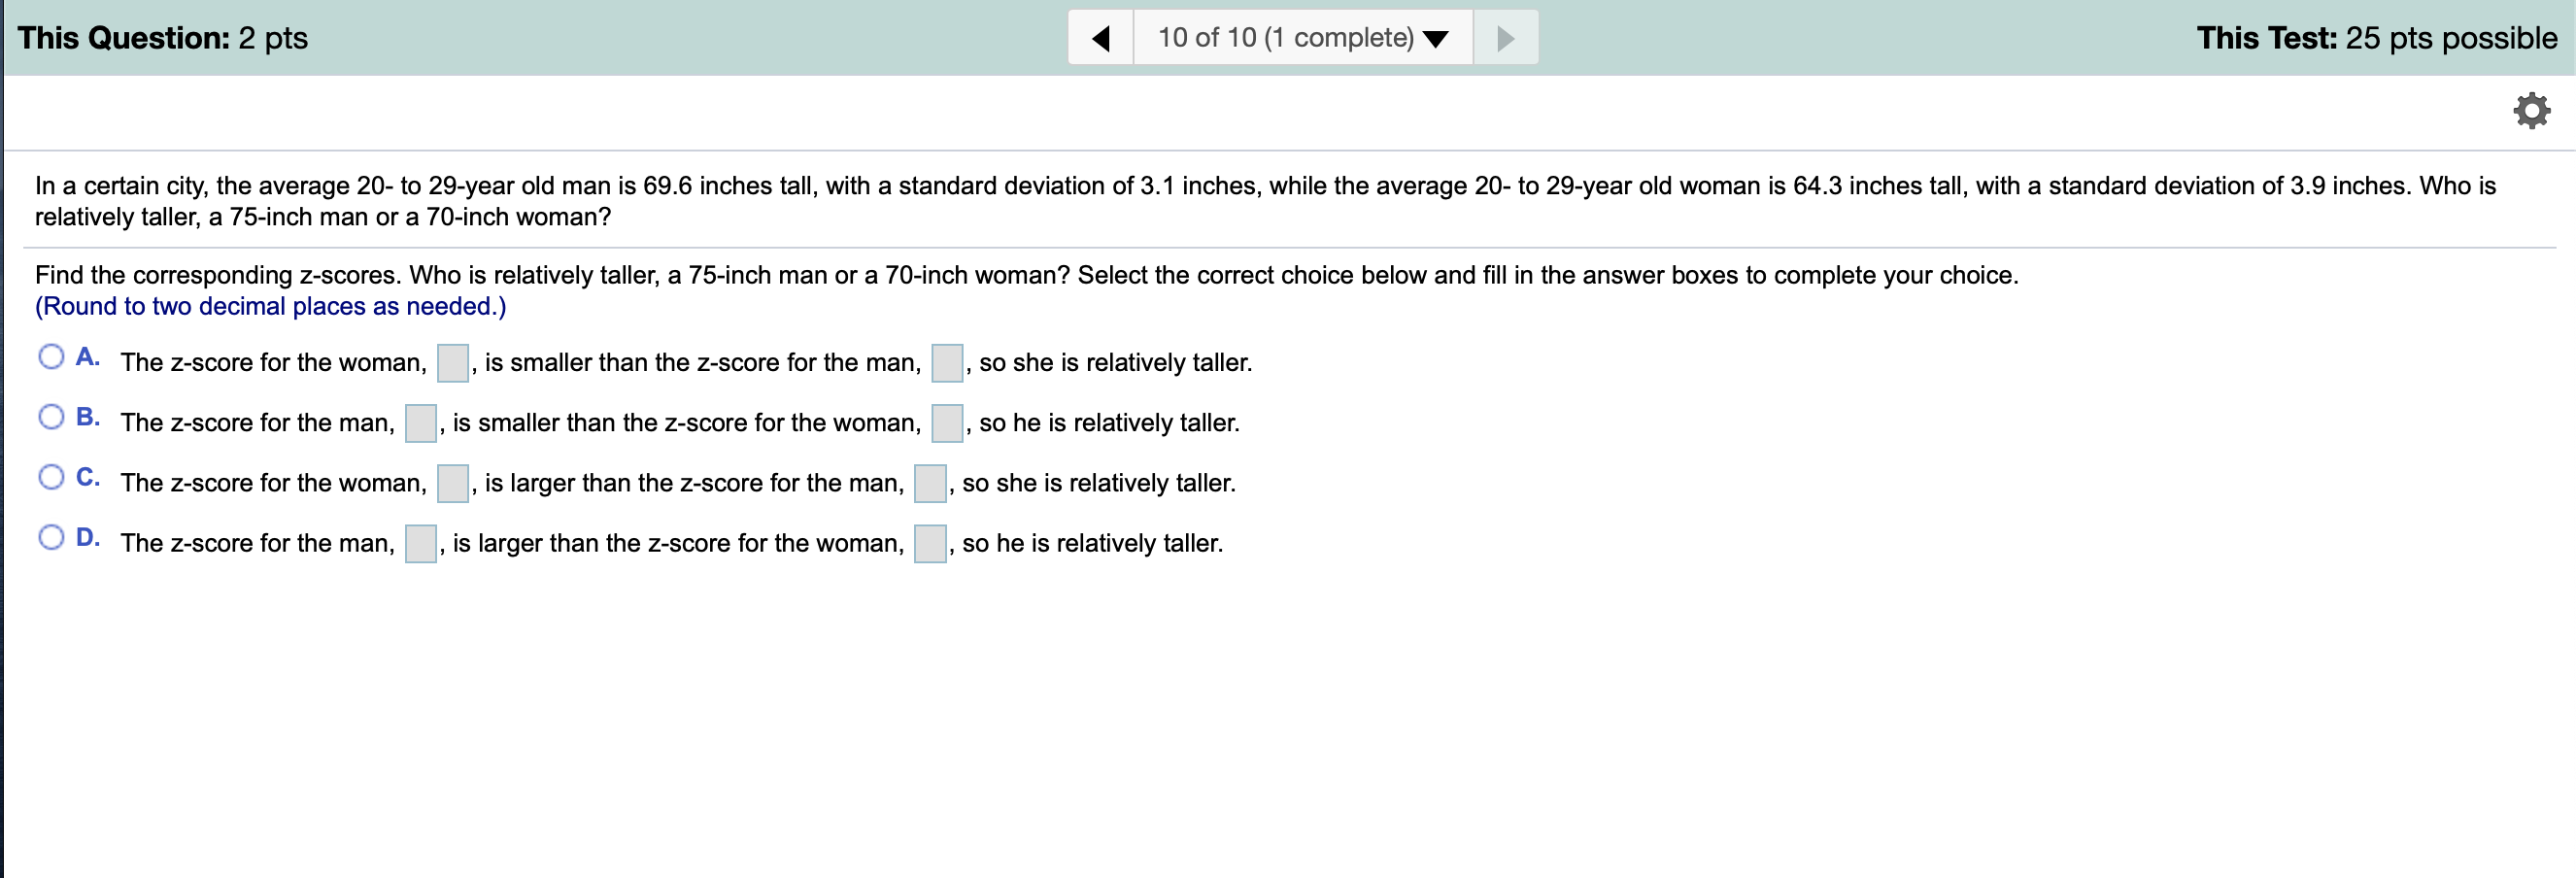
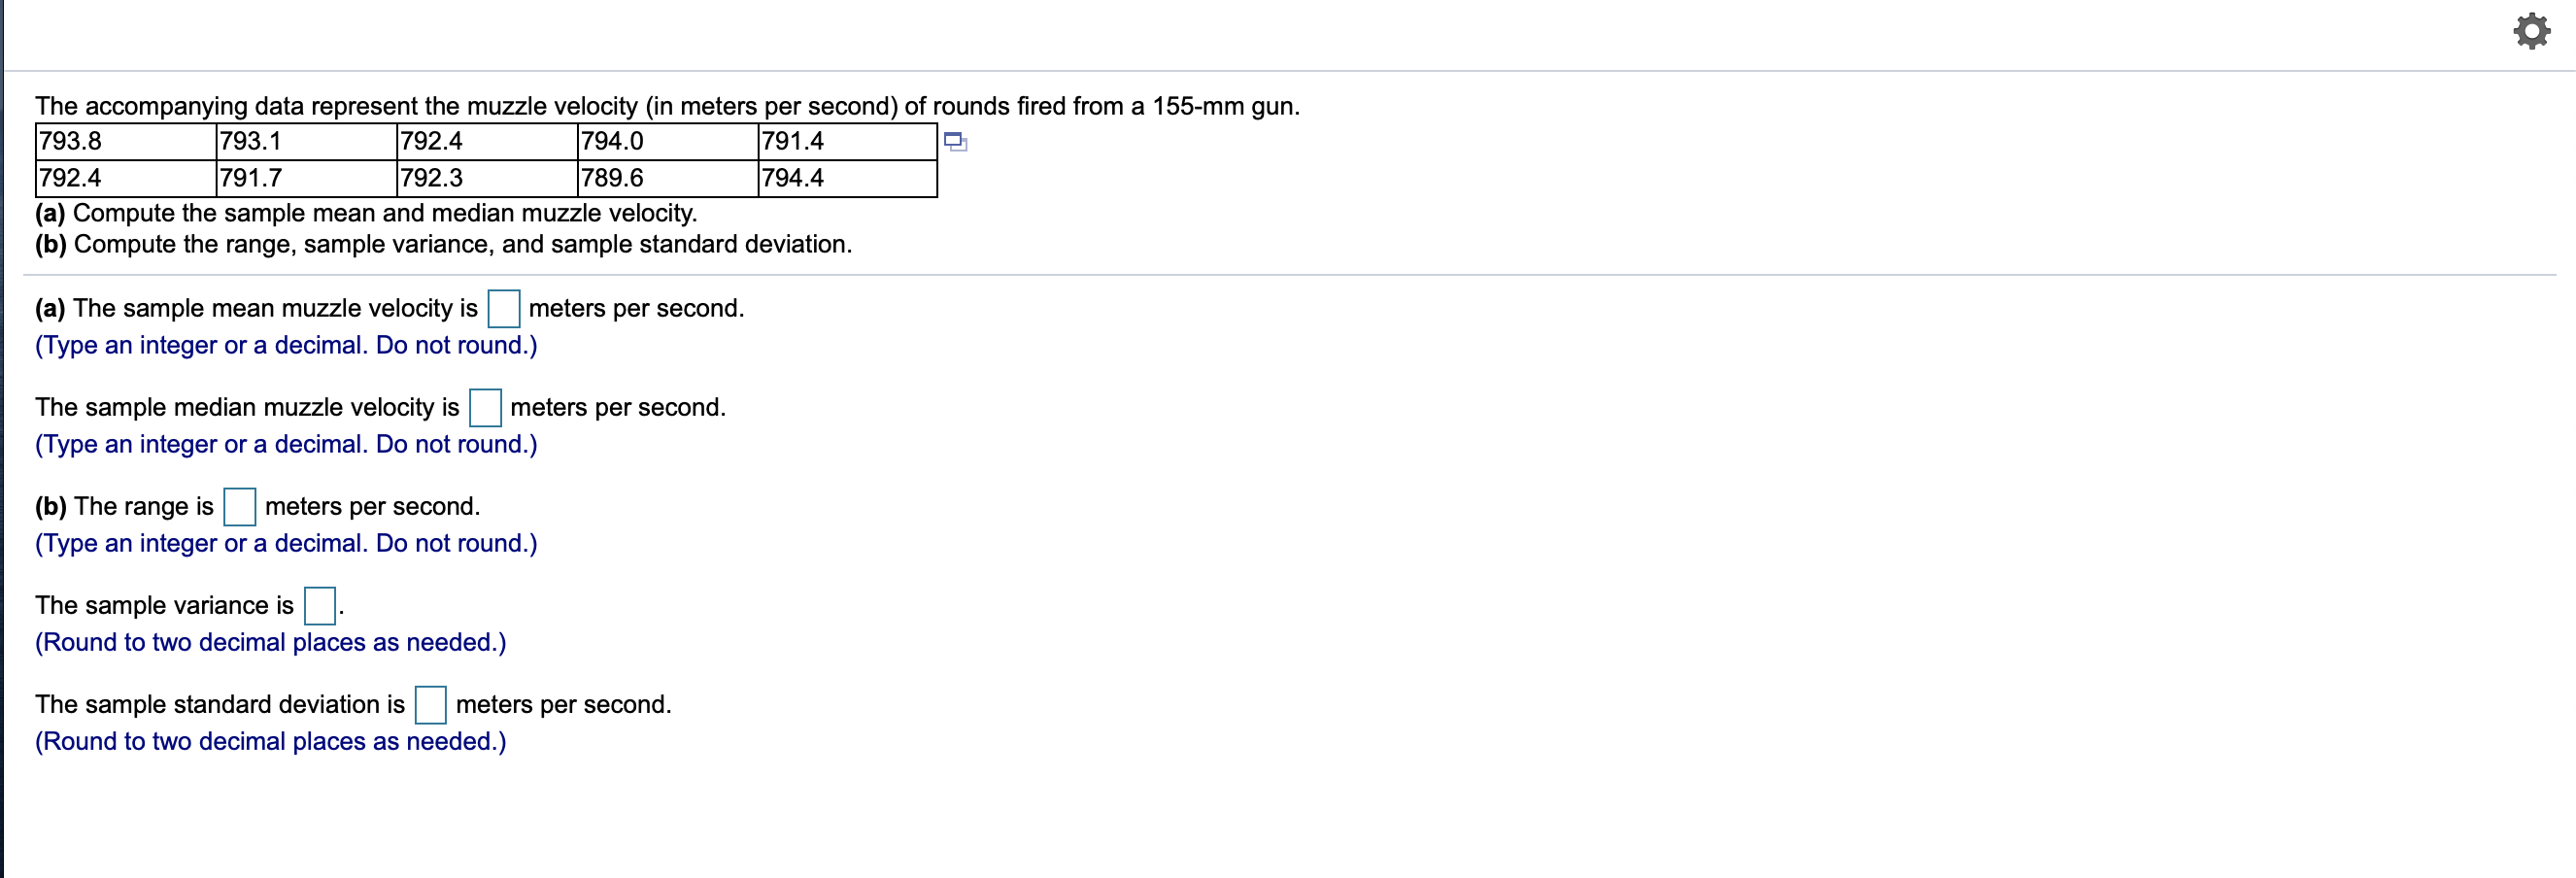
The following data represent the miles per gallon for a particular make and model car for six randomly selected vehicles. Compute the mean, median, and mode miles per gallon. 38.7, 39.5, 22.8, 22.7, 26.9, 24.2 Compute the mean miles per gallon. Select the correct choice below and, if necessary, fill in the answer box to complete your choice. A. The mean mileage per gallon is (Round to two decimal places as needed.) B. The mean does not exist. Compute the median miles per gallon. Select the correct choice below and, if necessary, fill in the answer box to complete your choice. A. The median mileage per gallon is . (Round to two decimal places as needed.) B. The median does not exist. Compute the mode miles per gallon. Select the correct choice below and, if necessary, fill in the answer box to complete your choice. A. The mode is (Round to two decimal places as needed. Use a comma to separate answers as needed.) B. The mode does not exist. The following data represent the miles per gallon for a particular make and model car for six randomly selected vehicles. Compute the mean, median, and mode miles per gallon. 38.7, 39.5, 22.8, 22.7, 26.9, 24.2 Compute the mean miles per gallon. Select the correct choice below and, if necessary, fill in the answer box to complete your choice. A. The mean mileage per gallon is (Round to two decimal places as needed.) B. The mean does not exist. Compute the median miles per gallon. Select the correct choice below and, if necessary, fill in the answer box to complete your choice. A. The median mileage per gallon is . (Round to two decimal places as needed.) B. The median does not exist. Compute the mode miles per gallon. Select the correct choice below and, if necessary, fill in the answer box to complete your choice. A. The mode is (Round to two decimal places as needed. Use a comma to separate answers as needed.) B. The mode does not exist. The data represent the age of world leaders on their day of inauguration. Find the five-number summary, and construct a boxplot for the data. Comment on the shape of the distribution. 51 52 55 51 50 46 46 48 44 43 44 56 61 63 67 The five-number summary is (Use ascending order.) Choose the correct boxplot of the data below. A. B. OC. 40 50 60 70 TIIIIIIIIIIIIIIII 40 50 60 70 40 50 60 70 Choose the correct description of the shape of the distribution. A. The distribution is roughly symmetric. B. The distribution is skewed to the right. C. The distribution is skewed to the left. D. The shape of the distribution cannot be determined from the boxplot. Find the sample variance and standard deviation. 4, 51, 13, 48, 33, 27, 28, 30, 31, 30 O Choose the correct answer below. Fill in the answer box to complete your choice. (Round to two decimal places as needed.) A. ? = B. 62 = = Choose the correct answer below. Fill in the answer box to complete your choice. (Round to one decimal place as needed.) A. 0= o B. SE This Question: 2 pts 10 of 10 (1 complete) This Test: 25 pts possible In a certain city, the average 20- to 29-year old man is 69.6 inches tall, with a standard deviation of 3.1 inches, while the average 20- to 29-year old woman is 64.3 inches tall, with a standard deviation of 3.9 inches. Who is relatively taller, a 75-inch man or a 70-inch woman? Find the corresponding z-scores. Who is relatively taller, a 75-inch man or a 70-inch woman? Select the correct choice below and fill in the answer boxes to complete your choice. (Round to two decimal places as needed.) O A. The z-score for the woman, is smaller than the Z-score for the man, so she is relatively taller. B. The z-score for the man, is smaller than the z-score for the woman, so he is relatively taller. C. The z-score for the woman, is larger than the Z-score for the man, so she is relatively taller. D. The Z-score for the man, is larger than the z-score for the woman, so he is relatively taller. o The accompanying data represent the muzzle velocity (in meters per second) of rounds fired from a 155-mm gun. 793.8 793.1 |792.4 794.0 791.4 1792.4 791.7 792.3 789.6 794.4 (a) Compute the sample mean and median muzzle velocity. (b) Compute the range, sample variance, and sample standard deviation. (a) The sample mean muzzle velocity is meters per second. (Type an integer or a decimal. Do not round.) The sample median muzzle velocity is meters per second. (Type an integer or a decimal. Do not round.) (b) The range is meters per second. (Type an integer or a decimal. Do not round.) The sample variance is (Round to two decimal places as needed.) The sample standard deviation is meters per second. (Round to two decimal places as needed.)


