

Question: The following data represent the speed at which a ball was hit (in miles per hour) and the distance it traveled (in feet) for a
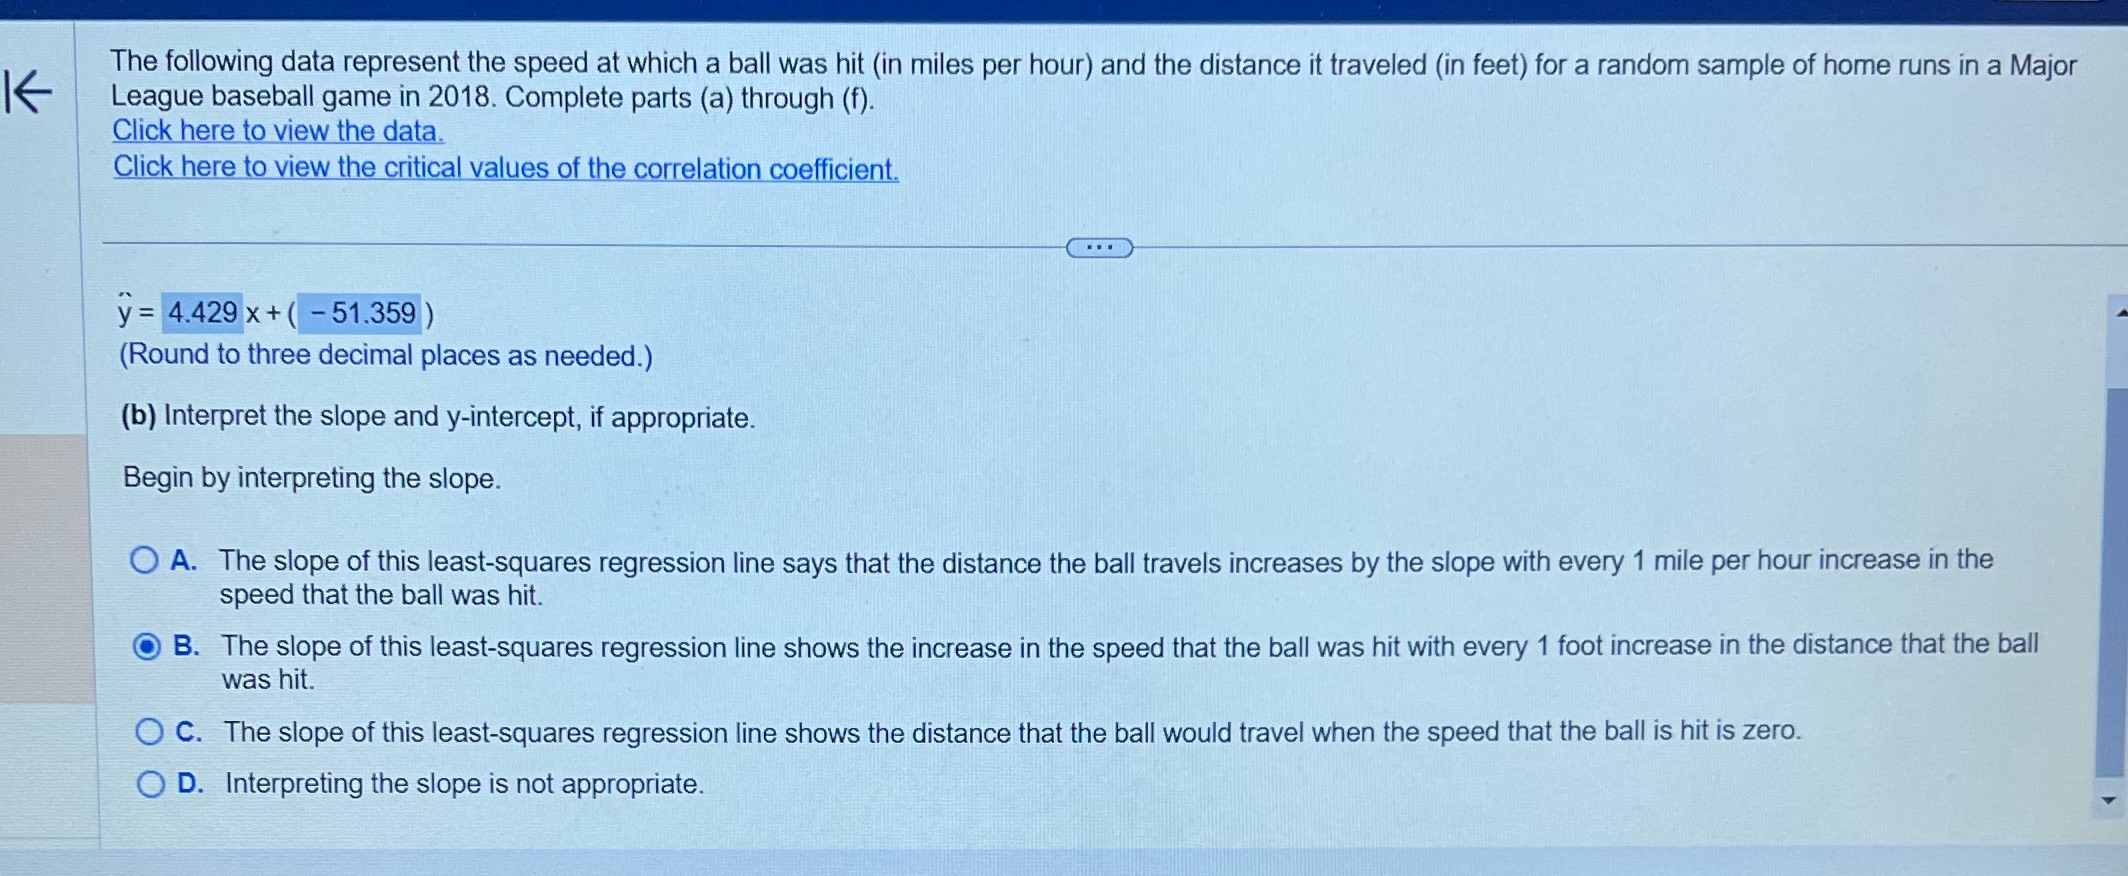

The following data represent the speed at which a ball was hit (in miles per hour) and the distance it traveled (in feet) for a random sample of home runs in a Major K League baseball game in 2018. Complete parts (a) through (f). Click here to view the data. Click here to view the critical values of the correlation coefficient. y = 4.429 x + (-51.359 ) (Round to three decimal places as needed.) (b) Interpret the slope and y-intercept, if appropriate. Begin by interpreting the slope. O A. The slope of this least-squares regression line says that the distance the ball travels increases by the slope with every 1 mile per hour increase in the speed that the ball was hit. O B. The slope of this least-squares regression line shows the increase in the speed that the ball was hit with every 1 foot increase in the distance that the ball was hit. O C. The slope of this least-squares regression line shows the distance that the ball would travel when the speed that the ball is hit is zero. O D. Interpreting the slope is not appropriate
Step by Step Solution
There are 3 Steps involved in it

Get step-by-step solutions from verified subject matter experts