

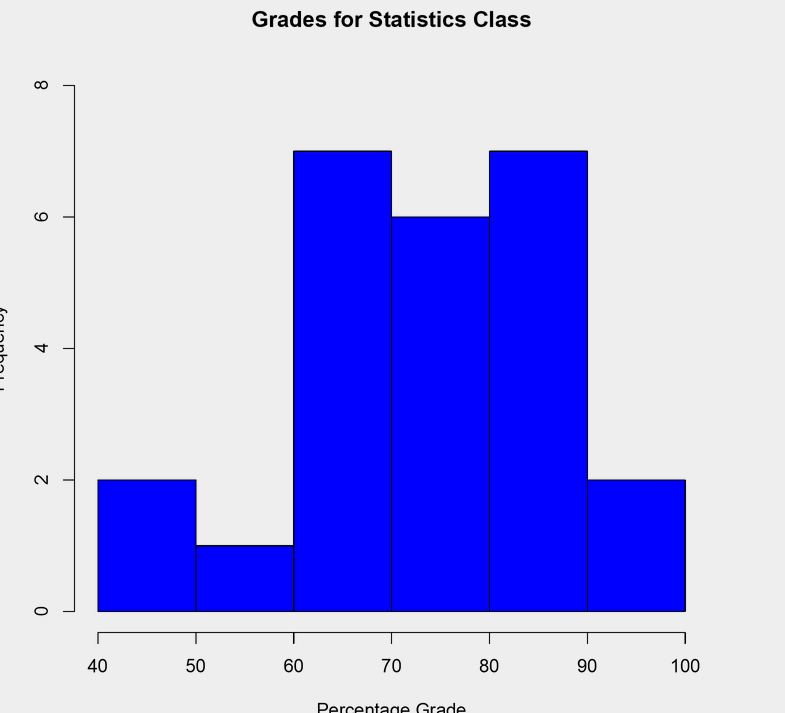
Question: The following data represents the grades in a statistics course. Below is the frequency distribution and histogram. How many students were in the class?

The following data represents the grades in a statistics course. Below is the frequency distribution and histogram. How many students were in the class?
Step by Step Solution
There are 3 Steps involved in it
1 Expert Approved Answer
Step: 1 Unlock

Question Has Been Solved by an Expert!
Get step-by-step solutions from verified subject matter experts
Step: 2 Unlock
Step: 3 Unlock