

Question: answer all these pls asap THINK! Q1. The five key characteristics of data are: Lower limits, upper limits, boundaries, mid-points and width Centre, frequency, distribution,
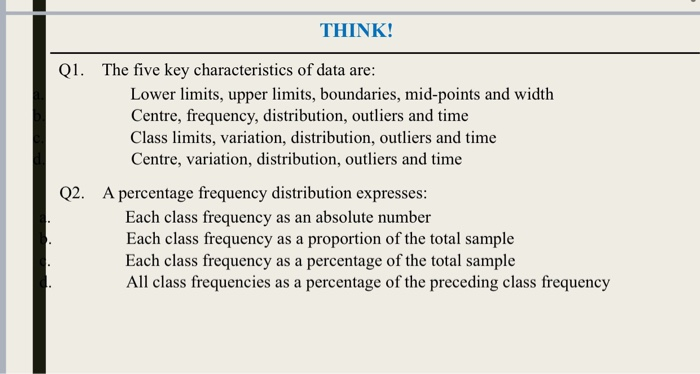

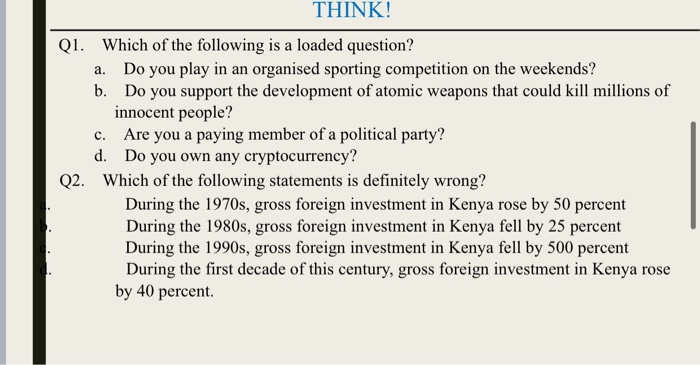
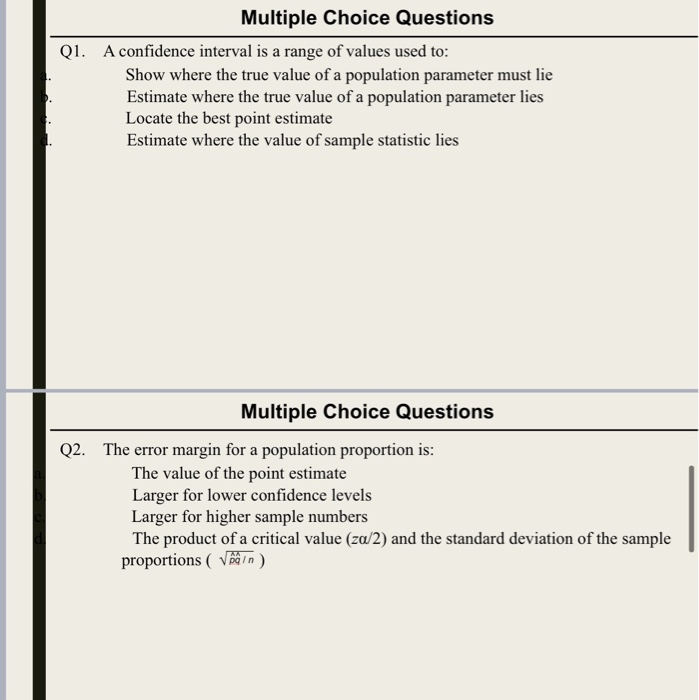
THINK! Q1. The five key characteristics of data are: Lower limits, upper limits, boundaries, mid-points and width Centre, frequency, distribution, outliers and time Class limits, variation, distribution, outliers and time Centre, variation, distribution, outliers and time Q2. A percentage frequency distribution expresses: Each class frequency as an absolute number Each class frequency as a proportion of the total sample Each class frequency as a percentage of the total sample All class frequencies as a percentage of the preceding class frequency THINK! a. Q3. Which of the following is a parameter? The number of people surveyed in each of the next several Gallup polls b. The ages recorded in a sample of students taking a statistics class C. The number of capital cities in Australia d. The number of people included in unemployment surveys Q4. Which of the following is an example of ratio measurement? Distances (to the nearest kilometre) between Australian capital cities b. Body temperatures in degrees Celsius c. Rankings of Australian universities by the Australian government d. The eye colours of students in this class a. THINK! Q1. Which of the following is a loaded question? a. Do you play in an organised sporting competition on the weekends? b. Do you support the development of atomic weapons that could kill millions of innocent people? c. Are you a paying member of a political party? d. Do you own any cryptocurrency? Q2. Which of the following statements is definitely wrong? During the 1970s, gross foreign investment in Kenya rose by 50 percent During the 1980s, gross foreign investment in Kenya fell by 25 percent During the 1990s, gross foreign investment in Kenya fell by 500 percent During the first decade of this century, gross foreign investment in Kenya rose by 40 percent. Multiple Choice Questions Q1. A confidence interval is a range of values used to: Show where the true value of a population parameter must lie Estimate where the true value of a population parameter lies Locate the best point estimate Estimate where the value of sample statistic lies Multiple Choice Questions Q2. The error margin for a population proportion is: The value of the point estimate Larger for lower confidence levels Larger for higher sample numbers The product of a critical value (zQ/2) and the standard deviation of the sample proportions ( vain)
Step by Step Solution
There are 3 Steps involved in it

Get step-by-step solutions from verified subject matter experts