

Question: The following data set contains data from a sample of 10 states out of the 50 states in the United States. Notice that in this
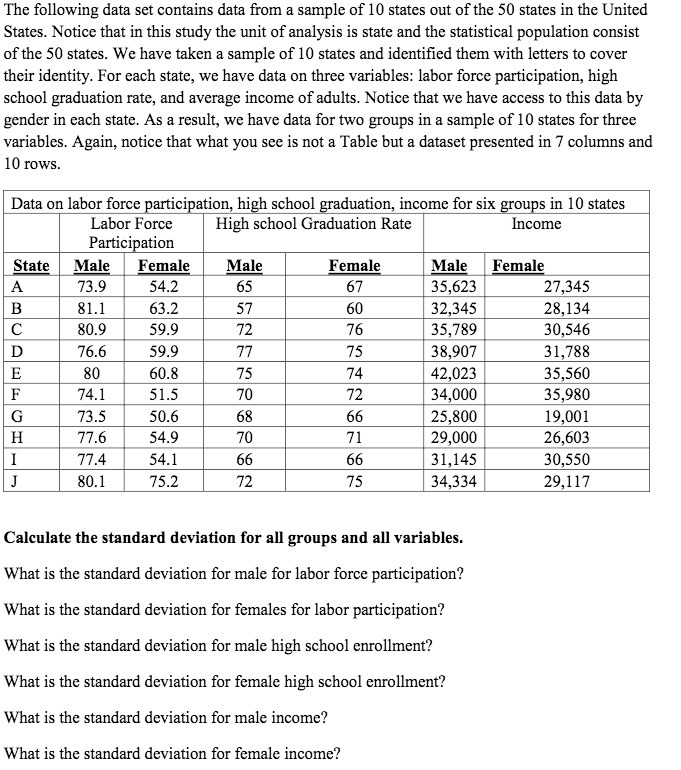
The following data set contains data from a sample of 10 states out of the 50 states in the United States. Notice that in this study the unit of analysis is state and the statistical population consist of the 50 states. We have taken a sample of 10 states and identified them with letters to cover their identity. For each state, we have data on three variables: labor force participation, high school graduation rate, and average income of adults. Notice that we have access to this data by gender in each state. As a result, we have data for two groups in a sample of 10 states for three variables. Again, notice that what you see is not a Table but a dataset presented in 7 columns and 10 rows. Data on labor force participation, high school graduation, income for six groups in 10 states Labor Force High school Graduation Rate Income Participation State Male Female Male Female Male Female A 73.9 54.2 65 67 35,623 27,345 B 81.1 63.2 57 60 32,345 28,134 C 80.9 59.9 72 76 35,789 30,546 D 76.6 59.9 77 75 38,907 31,788 E 80 60.8 75 74 42,023 35,560 F 74.1 51.5 70 72 34,000 35,980 G 73.5 50.6 68 66 25,800 19,001 H 77.6 54.9 70 71 29,000 26,603 77.4 54.1 66 66 31,145 30,550 80.1 75.2 72 75 34,334 29,117 Calculate the standard deviation for all groups and all variables. What is the standard deviation for male for labor force participation? What is the standard deviation for females for labor participation? What is the standard deviation for male high school enrollment? What is the standard deviation for female high school enrollment? What is the standard deviation for male income? What is the standard deviation for female income
Step by Step Solution
There are 3 Steps involved in it

Get step-by-step solutions from verified subject matter experts