Question: | The following data shows 6 samples with 5 observations for each sample. The sample values represent the weight in ounces for a product. Center
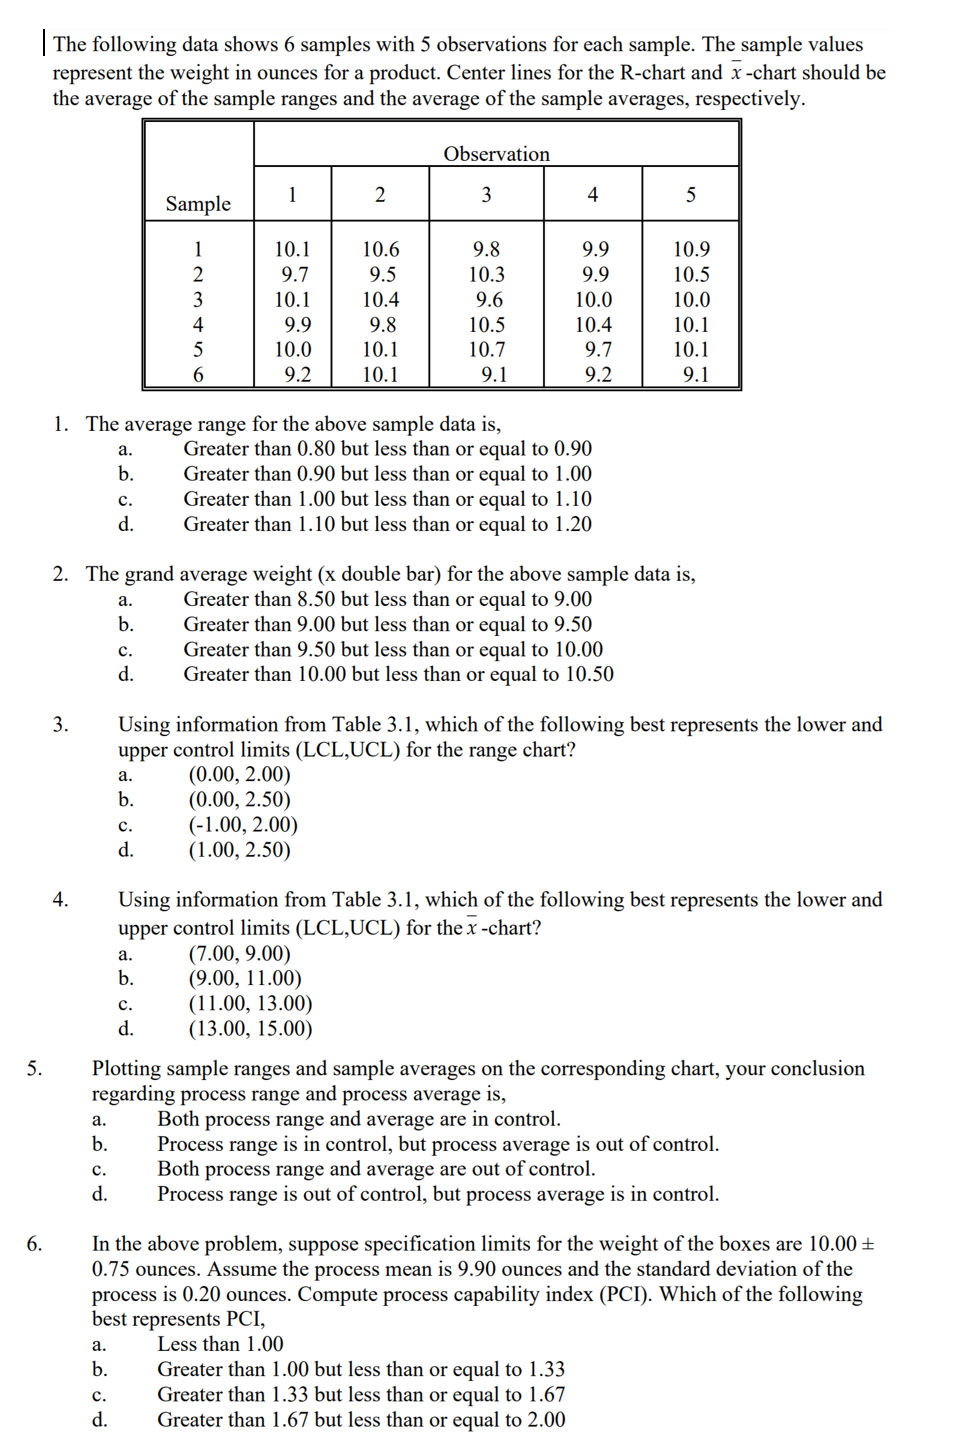
| The following data shows 6 samples with 5 observations for each sample. The sample values represent the weight in ounces for a product. Center lines for the R-chart and x-chart should be the average of the sample ranges and the average of the sample averages, respectively. Observation 1 2 3 4 5 Sample 1 2 3 4 5 6 10.1 9.7 10.1 9.9 10.0 9.2 10.6 9.5 10.4 9.8 10.1 10.1 9.8 10.3 9.6 10.5 10.7 9.1 9.9 9.9 10.0 10.4 9.7 9.2 10.9 10.5 10.0 10.1 10.1 9.1 a. 1. The average range for the above sample data is, Greater than 0.80 but less than or equal to 0.90 b. Greater than 0.90 but less than or equal to 1.00 c. Greater than 1.00 but less than or equal to 1.10 d. Greater than 1.10 but less than or equal to 1.20 a. 2. The grand average weight (x double bar) for the above sample data is, Greater than 8.50 but less than or equal to 9.00 b. Greater than 9.00 but less than or equal to 9.50 c. Greater than 9.50 but less than or equal to 10.00 d. Greater than 10.00 but less than or equal to 10.50 3. a. Using information from Table 3.1, which of the following best represents the lower and upper control limits (LCL,UCL) for the range chart? (0.00, 2.00) b. (0.00, 2.50) (-1.00, 2.00) d. (1.00, 2.50) c. 4. a. c. Using information from Table 3.1, which of the following best represents the lower and upper control limits (LCL,UCL) for the x-chart? (7.00, 9.00) b. (9.00, 11.00) (11.00, 13.00) d. (13.00, 15.00) Plotting sample ranges and sample averages on the corresponding chart, your conclusion regarding process range and process average is, a. Both process range and average are in control. b. Process range is in control, but process average is out of control. Both process range and average are out of control. d. Process range is out of control, but process average is in control. 5. c. 6. In the above problem, suppose specification limits for the weight of the boxes are 10.00 0.75 ounces. Assume the process mean is 9.90 ounces and the standard deviation of the process is 0.20 ounces. Compute process capability index (PCI). Which of the following best represents PCI, Less than 1.00 b. Greater than 1.00 but less than or equal to 1.33 Greater than 1.33 but less than or equal to 1.67 d. Greater than 1.67 but less than or equal to 2.00 a. c


