

Question: The following data table contains the annual average temperatures from 1950 to 2000 of a certain city Construct a time plot to investigate a possible
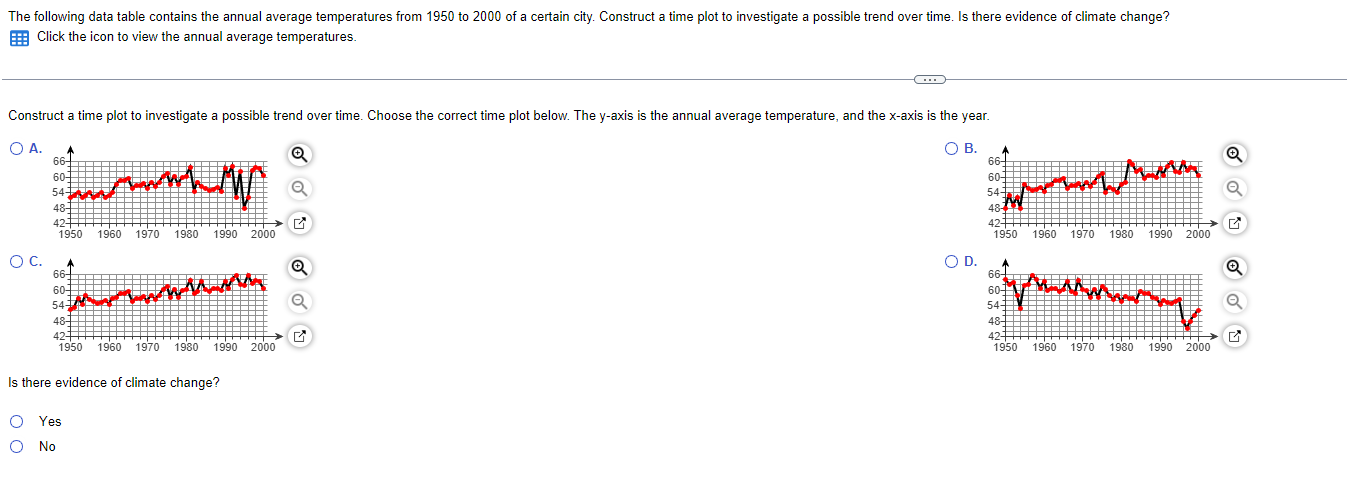
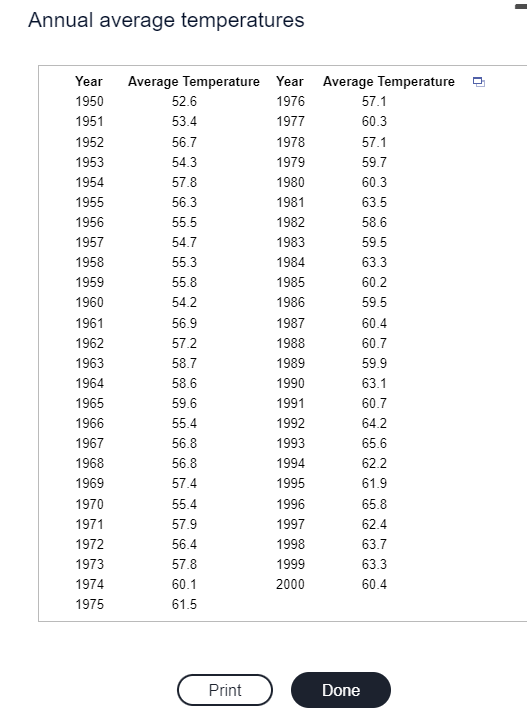
The following data table contains the annual average temperatures from 1950 to 2000 of a certain city Construct a time plot to investigate a possible trend over time. Is there evidence oi climate change? a Click the icon to view the annual average temperatures, Construct a time plot to investigate a possible trend over time. Choose the correct time plot below The yaxis is the annual average temperature and The xaxls is the year. 9:. 05.6 6 OA. 6 6 54 Q 54 Q 4 . 4 . 4 I3 4 I3 1950 1960 1970 1930 1950 2mm - 1950 1960 1970 1930 1950 2mm - 6% 5% a 6; I3 I3 1950 1960 1970 1980 1990 2000 - 1950 1960 1970 1980 1990 2000 Is there evidence oi climate change? OYes ONo Annual average temperatures Year Average Temperature Year Average Temperature 1950 52.6 1976 57.1 1951 53.4 1977 60.3 1952 56.7 1978 57.1 1953 54.3 1979 59.7 1954 57.8 1980 60.3 1955 56.3 1981 63.5 1956 55.5 1982 58.6 1957 54.7 1983 59.5 1958 55.3 1984 63.3 1959 55.8 1985 60.2 1960 54.2 1986 59.5 1961 56.9 1987 60.4 1962 57.2 1988 60.7 1963 58.7 1989 59.9 1964 58.6 1990 63.1 1965 59.6 1991 60.7 1966 55.4 1992 64.2 1967 56.8 1993 65.6 1968 56.8 1994 62.2 1969 57.4 1995 61.9 1970 55.4 1996 65.8 1971 57.9 1997 62.4 1972 56.4 1998 63.7 1973 57.8 1999 63.3 1974 60.1 2000 60.4 1975 61.5 Print Done
Step by Step Solution
There are 3 Steps involved in it

Get step-by-step solutions from verified subject matter experts