

Question: The following data was collected for Project Widget at Schuman Works. Data was collected following weeks 4 and 5. Note: AC = Actual Costs in
The following data was collected for Project Widget at Schuman Works. Data was collected following weeks 4 and 5. Note: AC = Actual Costs in the table below. This problem should be worked by hand or Excel, not using MSP.
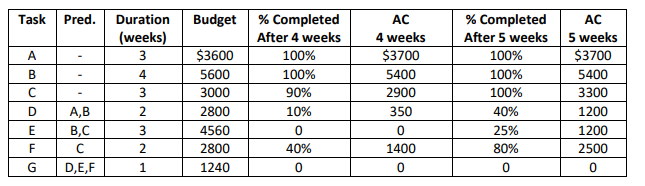
a. Calculate EV and PV for each task and the total for the project for each time period.
b. Calculate the CV, SV, CPI and SPI, ETC and EAC for the project (dont need each task) at each of those time periods.
c. What can you say about the health of the project?
d. Rework the information for parts a and b of problem 1 using the 50/50% rule for the percent completion. Any change in the health?
Task Pred. Budget A Duration (weeks) 3 4 3 B % Completed After 4 weeks 100% 100% 90% 10% 0 40% 0 AC 4 weeks $3700 5400 2900 350 0 1400 0 % Completed After 5 weeks 100% 100% 100% 40% 25% 80% 0 $3600 5600 3000 2800 4560 2800 1240 AC 5 weeks $3700 5400 3300 1200 1200 2500 D A,B B,C D,E,F E F PNWN G 0 Task Pred. Budget A Duration (weeks) 3 4 3 B % Completed After 4 weeks 100% 100% 90% 10% 0 40% 0 AC 4 weeks $3700 5400 2900 350 0 1400 0 % Completed After 5 weeks 100% 100% 100% 40% 25% 80% 0 $3600 5600 3000 2800 4560 2800 1240 AC 5 weeks $3700 5400 3300 1200 1200 2500 D A,B B,C D,E,F E F PNWN G 0
Step by Step Solution
There are 3 Steps involved in it

Get step-by-step solutions from verified subject matter experts