

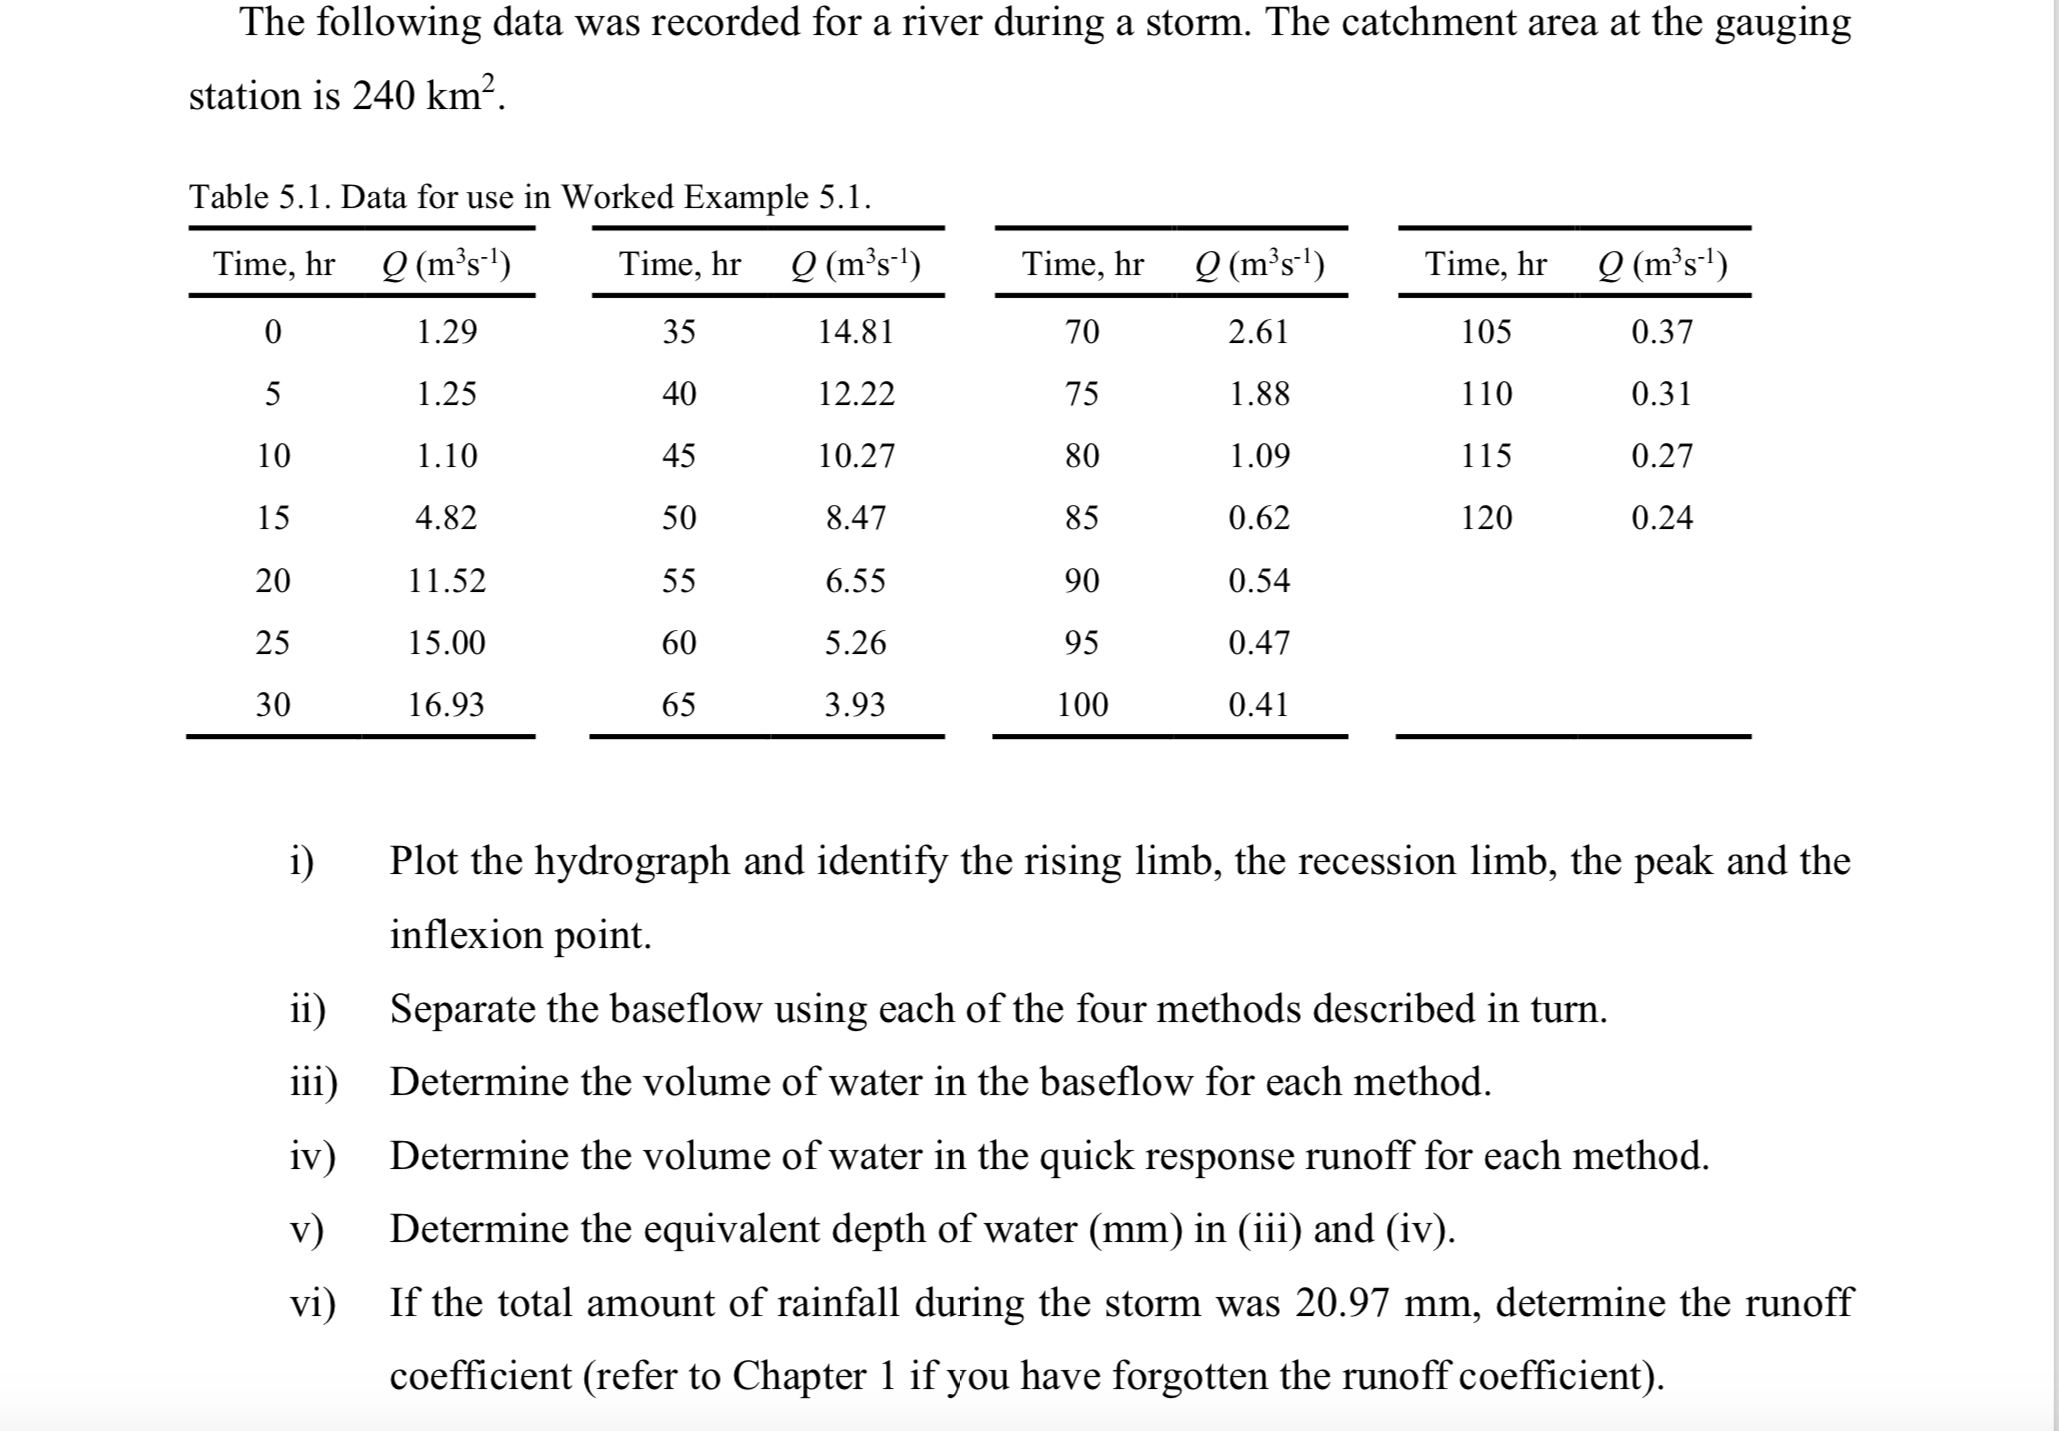
Question: The following data was recorded for a river during a storm. The catchment area at the gauging station is 2 4 0 k m 2
The following data was recorded for a river during a storm. The catchment area at the gauging
station is
Table Data for use in Worked Example
i Plot the hydrograph and identify the rising limb the recession limb the peak and the
inflexion point.
ii Separate the baseflow using horizontal line method, straight line method, fixed base method and variable base method
iii Determine the volume of water in the baseflow for each method.
iv Determine the volume of water in the quick response runoff for each method.
v Determine the equivalent depth of water in iii and iv
vi If the total amount of rainfall during the storm was determine the runoff
coefficient.
Step by Step Solution
There are 3 Steps involved in it
1 Expert Approved Answer
Step: 1 Unlock

Question Has Been Solved by an Expert!
Get step-by-step solutions from verified subject matter experts
Step: 2 Unlock
Step: 3 Unlock