

Question: The following data was used to construct process control charts. Reading Sample 1 1 814.4 2 809.5 3 788.1 4 802.0 5 810.0 6 820.7
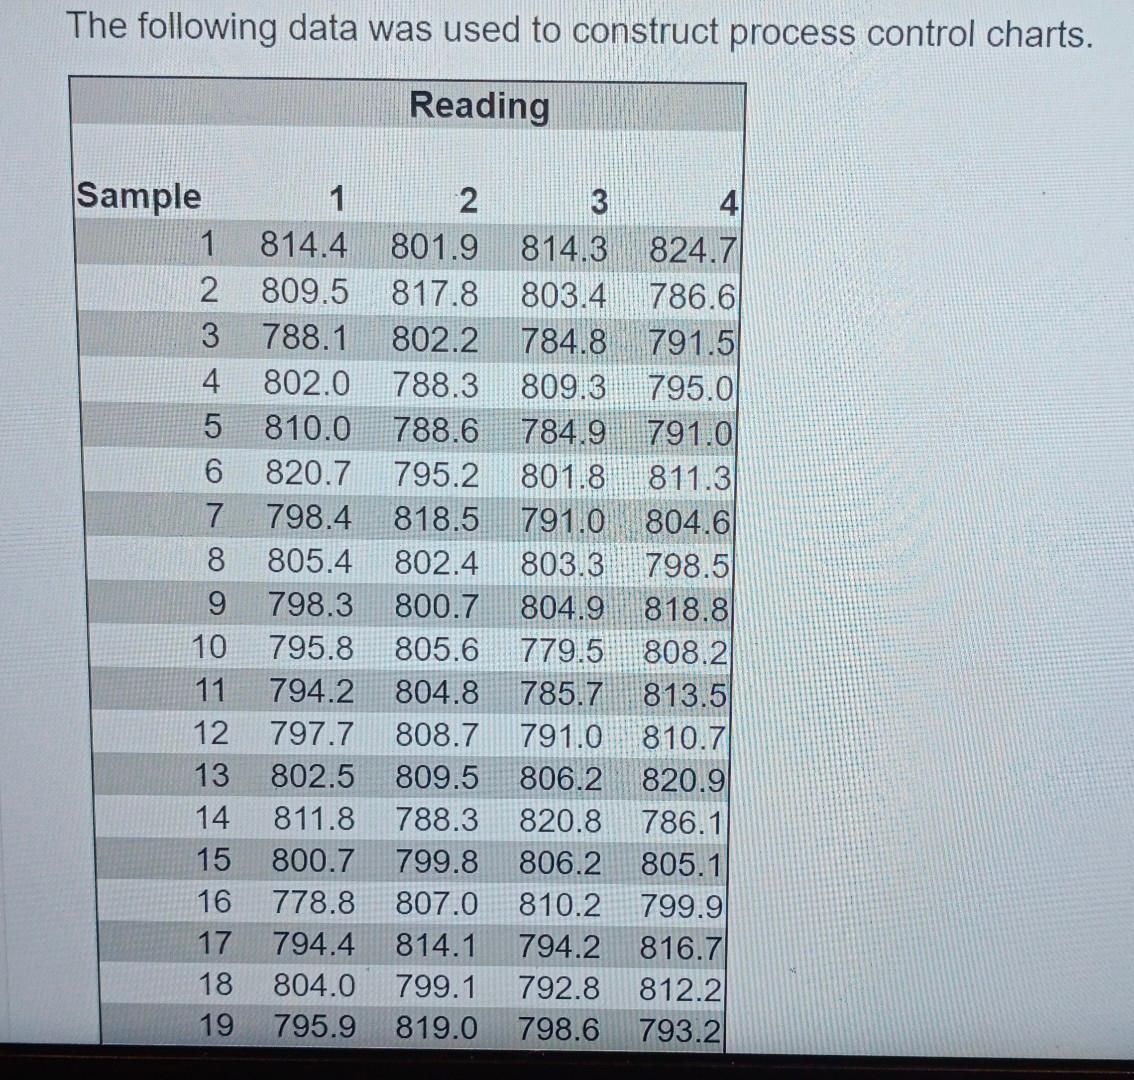
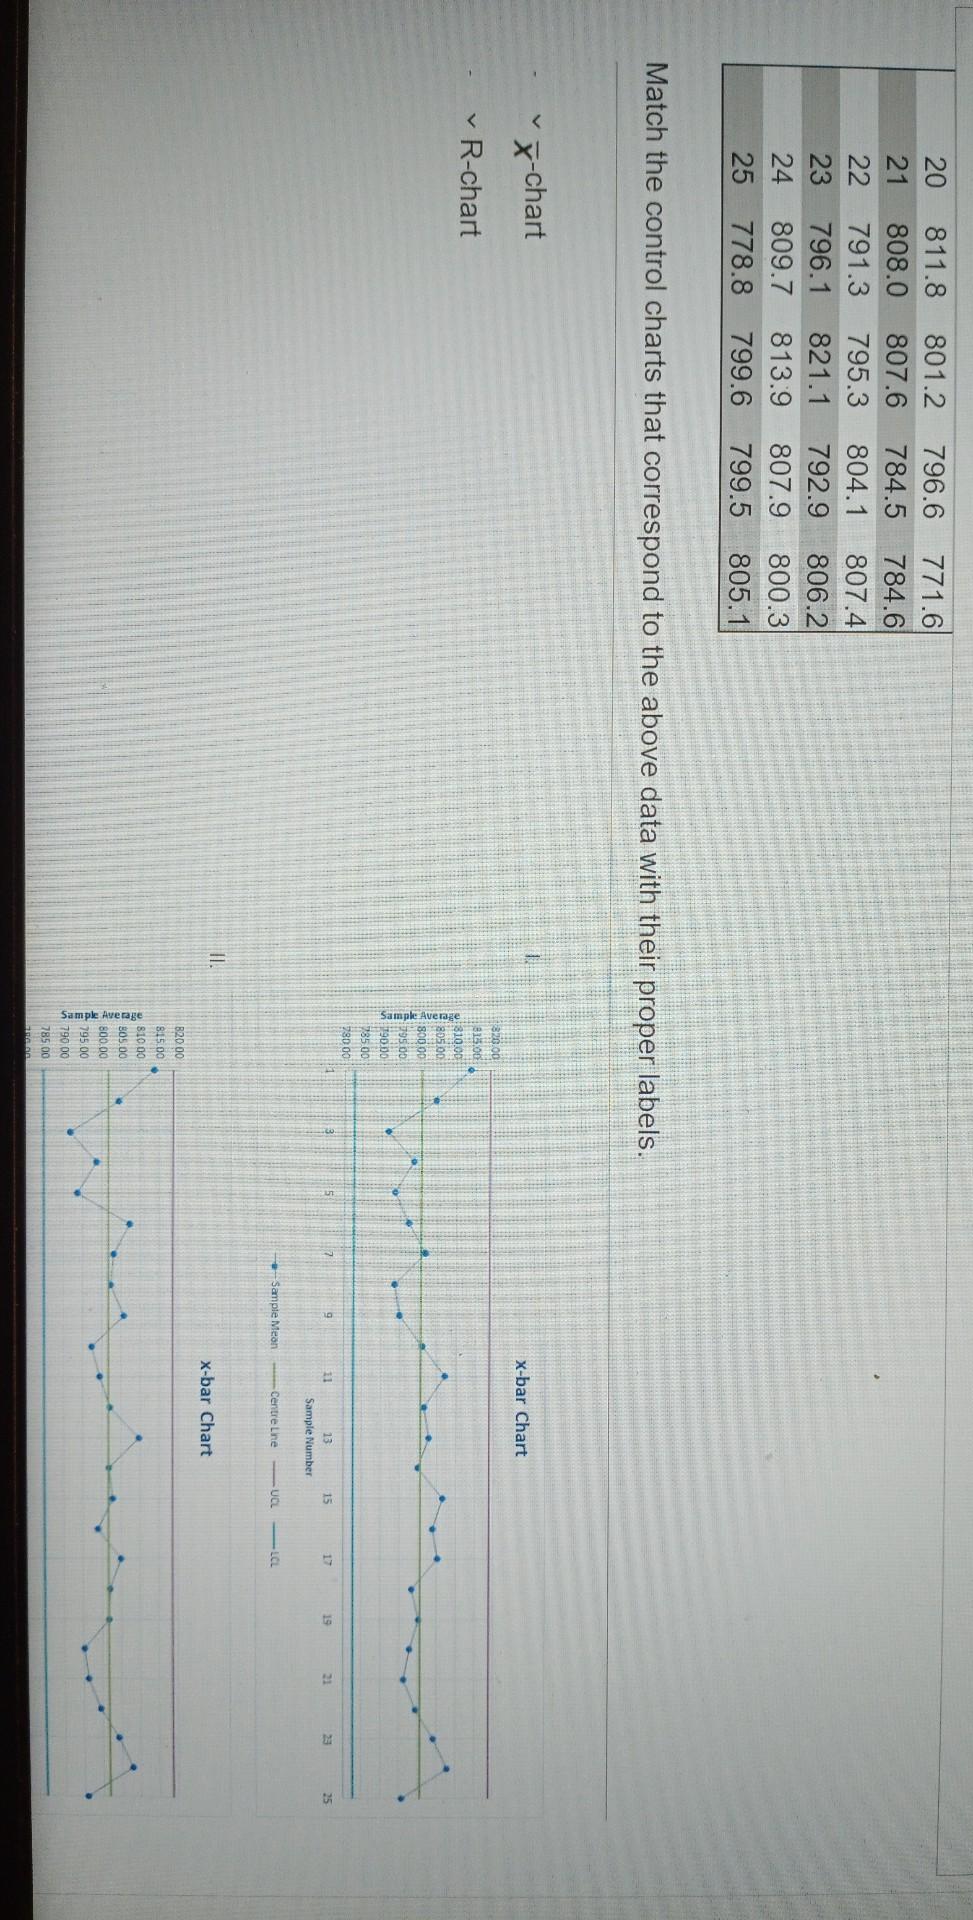
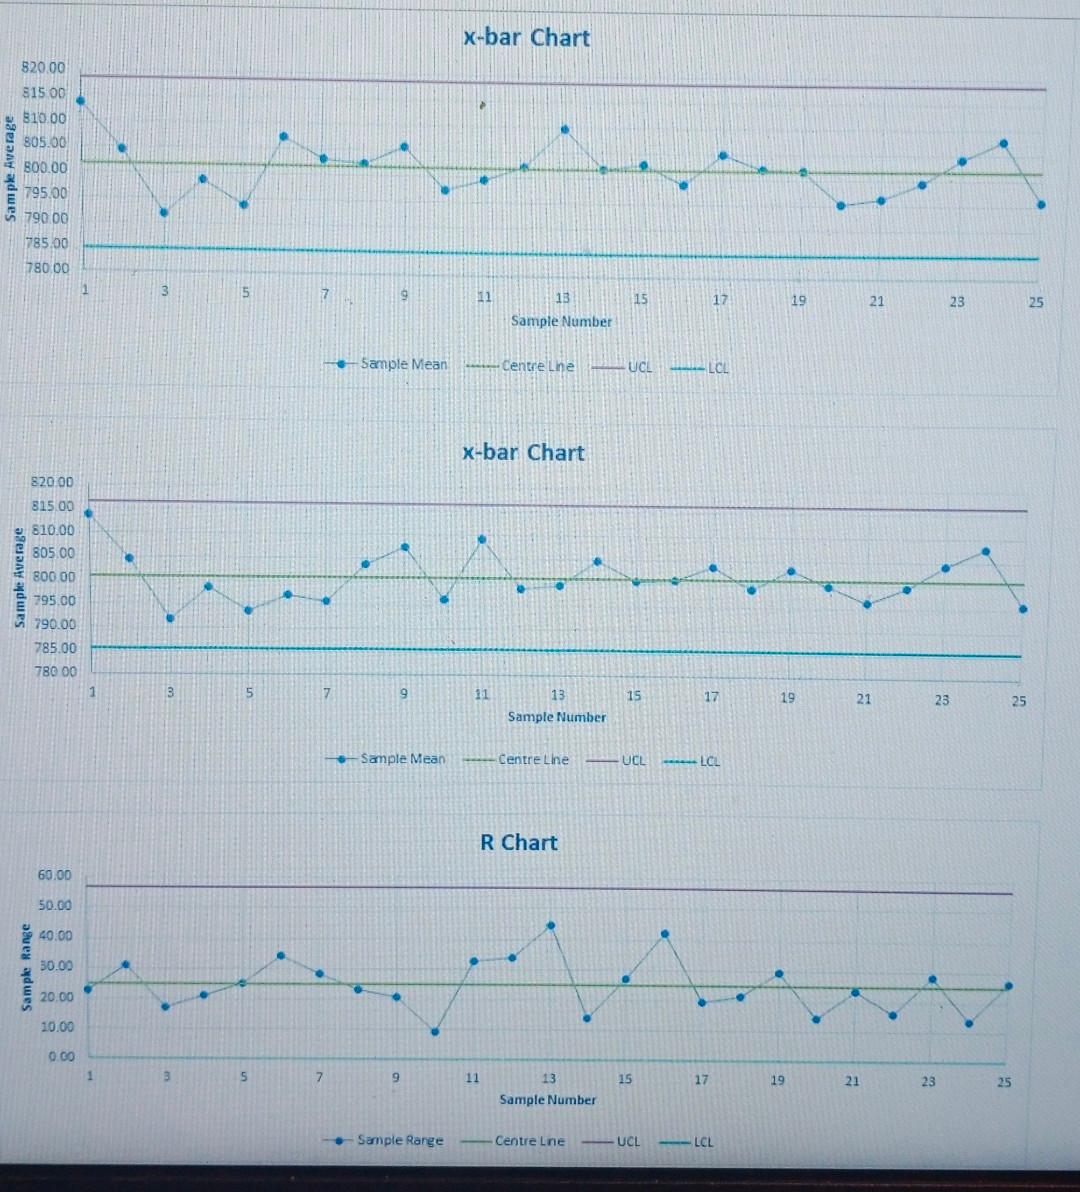
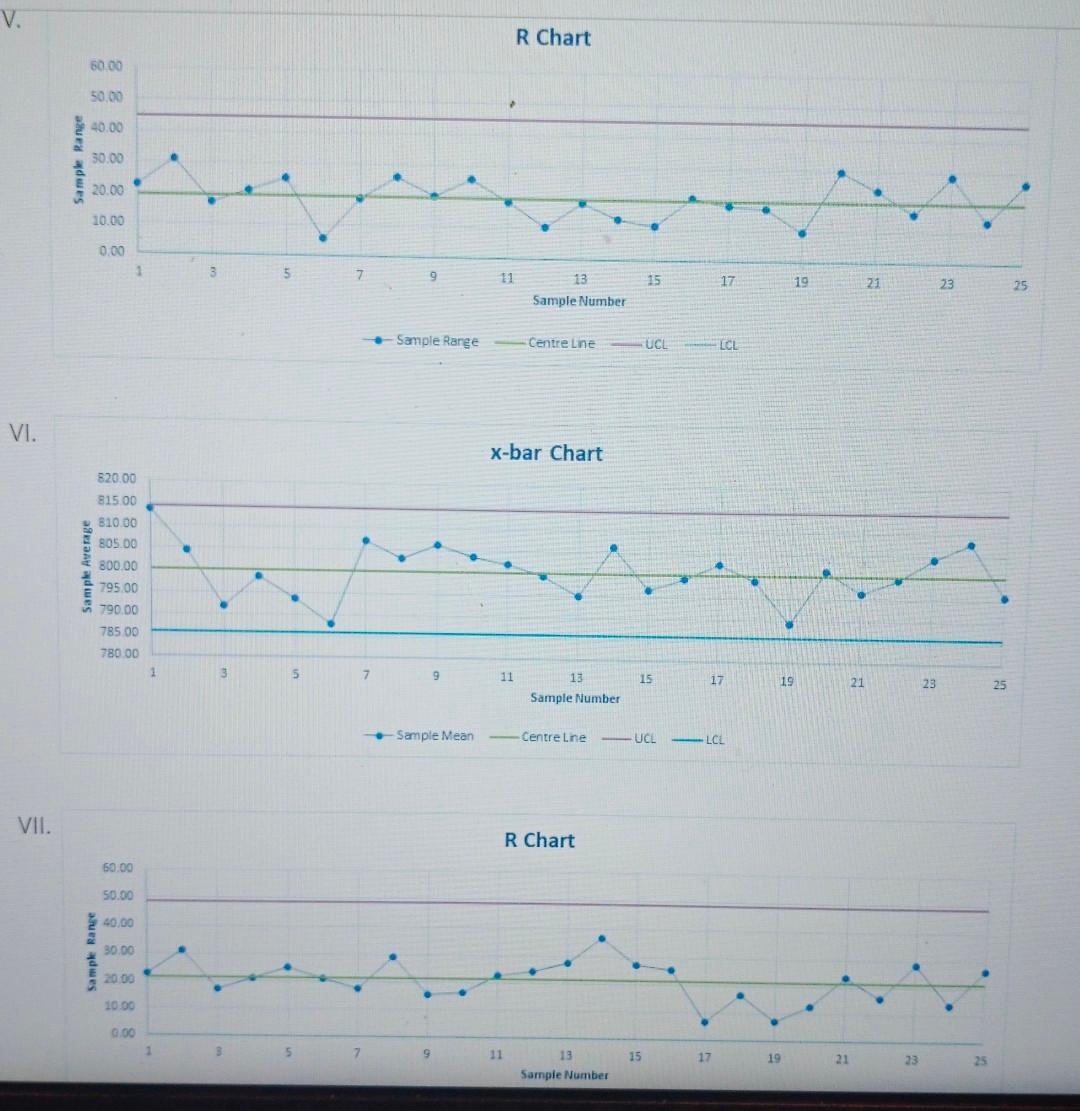
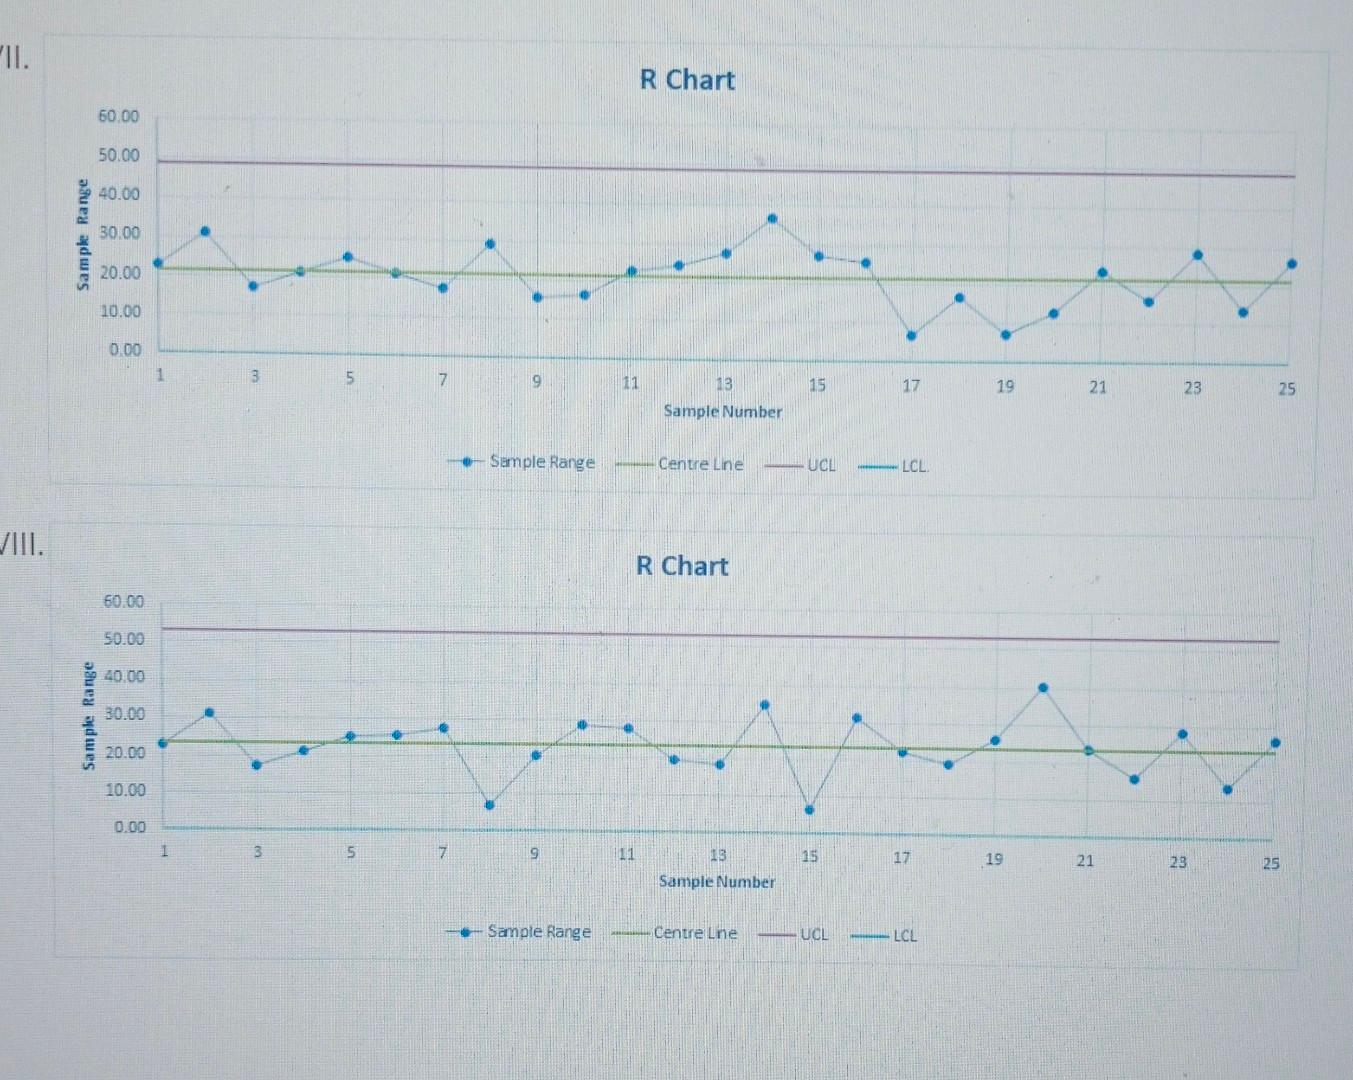
The following data was used to construct process control charts. Reading Sample 1 1 814.4 2 809.5 3 788.1 4 802.0 5 810.0 6 820.7 7 798.4 8 805.4 9 798.3 10 795.8 11 794.2 12 797.7 13 802.5 14 811.8 15 800.7 16 778.8 17 794.4 18 804.0 19 795.9 2 3 4 801.9 814.3 824.7 817.8 803.4. 786.6 802.2 784.8791.5 788.3 809.3|795.0 788.6 784.9 791.0 795.2 801.8 811.3 818.5 791.0 804.6 802.4 803.3 798.5 800.7 804.9 818.8 805.6 779.5 808.2 804.8 785.7 813.5 808.7 791.0 810.7 809.5 806.2 820.9 788.3 820.8 786.1 799.8 806.2 805.1 807.0 810.2 799.9 814.1 794.2 816.7 799.1 792.8 812.2 819.0 798.6 793.2 20 21 22 23 24 25 811.8 801.2 808.0 807.6 791.3 795.3 796.1 821.1 809.7 813.9 778.8 799.6 796.6 784.5 804.1 792.9 807.9 799.5 771.6 784.6 807.4 806.2 800.3 805.1 Match the control charts that correspond to the above data with their proper labels. x-chart x-bar Chart 1320.00 R-chart Sample Average 310.00 1805.00 800.00 195.00 190.00 198500 78000 17 g 15 17 19 21 23 25 13 Sample Number Sample Mean Centre Line UCL LCL II. x-bar Chart Sample Average B2000 8.15.00 81000 BO5.00 800.00 795.00 790.00 785.00 X-bar Chart 820.00 815.00 310.00 805.00 Sample Average 800.00 795.00 790.00 785.00 780.00 1 3 5 7 9 11 15 17 19 21 23 25 13 Sample Number + Sample Mean Centre Lhe - UCE -LCL x-bar Chart 820.00 6 Sample Average 815.00 810.00 805.00 800 00 795.00 790.00 785.00 780 00 . . 1 3 5 7 9 11 15 17 19 21 23 13 Sample Number 25 Sample Mean Centre Line-UCL -----LCL R Chart 60.00 50.00 40.00 Sample Range 30.00 20.00 . 10.00 000 1 3 5 7 9 11 15 17 19 21 23 25 13 Sample Number Sample Range Centre Line UCL LCL V. R Chart 60.00 50.00 40.00 Sample Range 30.00 . 20.00 10.00 0.00 1 3 5 7 9 15 17 19 21 13 Sample Number 23 25 + Sample Range Centre Line UCL LCL VI. x-bar Chart 820.00 815.00 310.00 805.00 Sample Average 800.00 795.00 790.00 785 00 78000 1 3 5 7 9 11 15 17 19 21 23 13 Sample Number 25 Sample Mean - Centre Line - UCL LCL VII. R Chart 60.00 50.00 40.00 Sampk Range 30.00 20.00 10.00 0.00 1 7 11 15 17 19 21 23 25 13 Sample Number R Chart 60.00 50.00 40.00 Sample Range 30.00 20.00 10.00 0.00 1 5 7 9 11 13 15 17 19 21 23 25 Sample Number - Sample Range Centre Lne UCL LCL R Chart 60.00 50.00 40.00 Sample Range 30.00 20.00 10.00 0.00 1 3 5 7 9 11 13 15 17 19 21 23 25 Sample Number Sample Range Centre Line ... UCL LCL
Step by Step Solution
There are 3 Steps involved in it
1 Expert Approved Answer
Step: 1 Unlock

Question Has Been Solved by an Expert!
Get step-by-step solutions from verified subject matter experts
Step: 2 Unlock
Step: 3 Unlock