

Question: The following data were from a two-factor between-subject study using 5 subjects in each treatment condition. On the basis draw an interaction graph using the
The following data were from a two-factor between-subject study using 5 subjects in each treatment condition.
- On the basis draw an interaction graph using the data of this experiment. Just by eyeballing the graph, is there an interaction effect? By eyeballing the table, is there a main effect for factor A? What about factor B?
- Please attempt to do two-way ANOVA to test the main effects and interaction effect. Use the .05 level of significance.
- Explain the main and interaction results to your grandma.
- Compute the effect size for each main effect and the interaction.
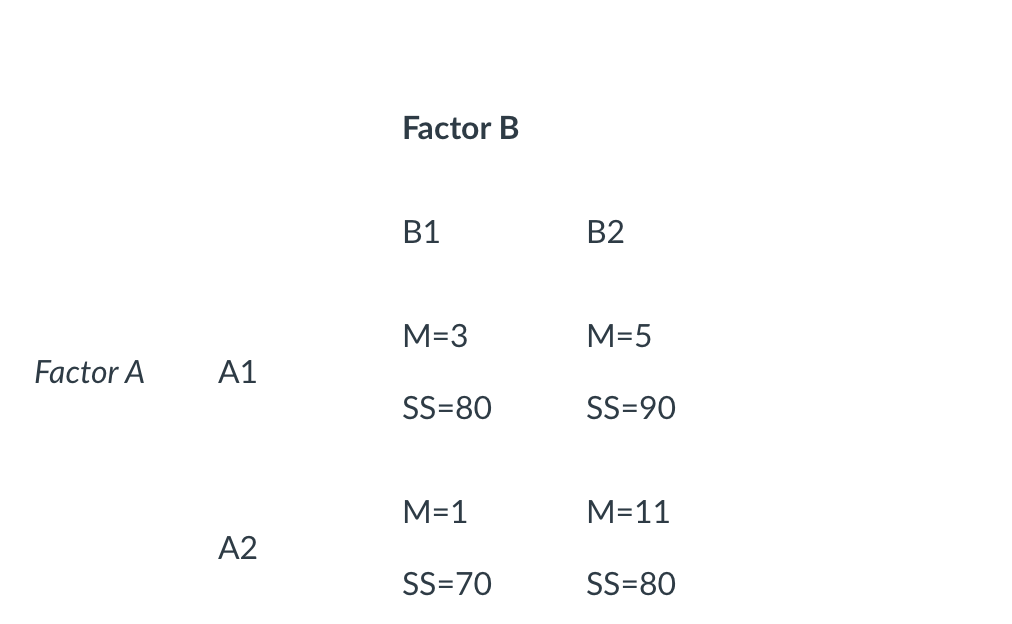
Factor B B1 B2 M=3 M=5 Factor A A1 SS=80 SS=90 M=1 M=11 A2 SS=70 SS=80
Step by Step Solution
There are 3 Steps involved in it
1 Expert Approved Answer
Step: 1 Unlock

Question Has Been Solved by an Expert!
Get step-by-step solutions from verified subject matter experts
Step: 2 Unlock
Step: 3 Unlock