

Question: The following data were taken from a study relating the Days High Temperature to the Average Amount of Cola Consumed (per capita) in a small

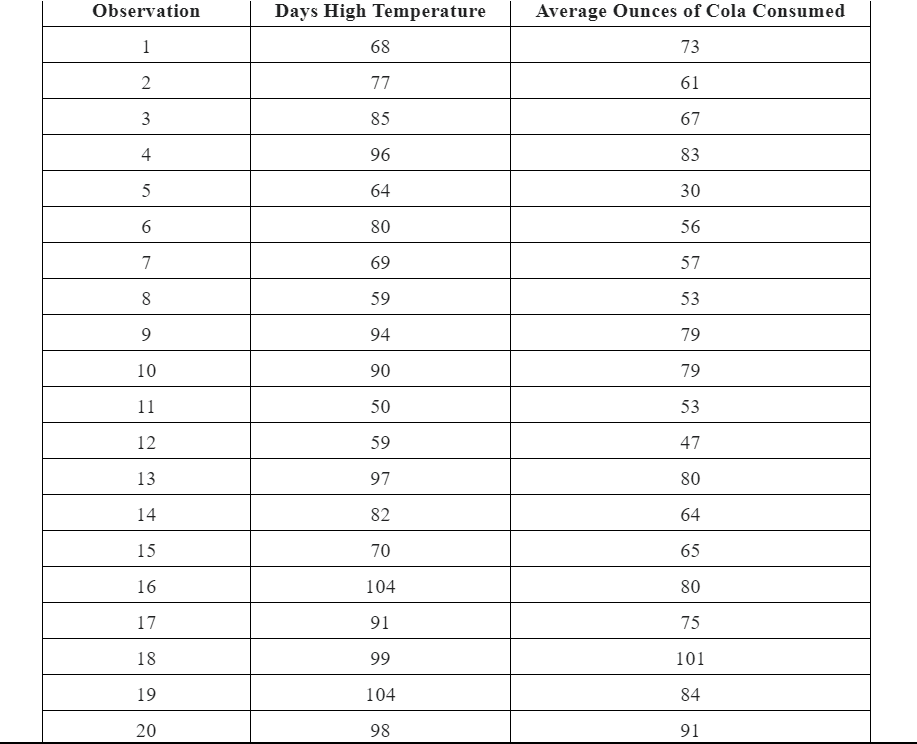
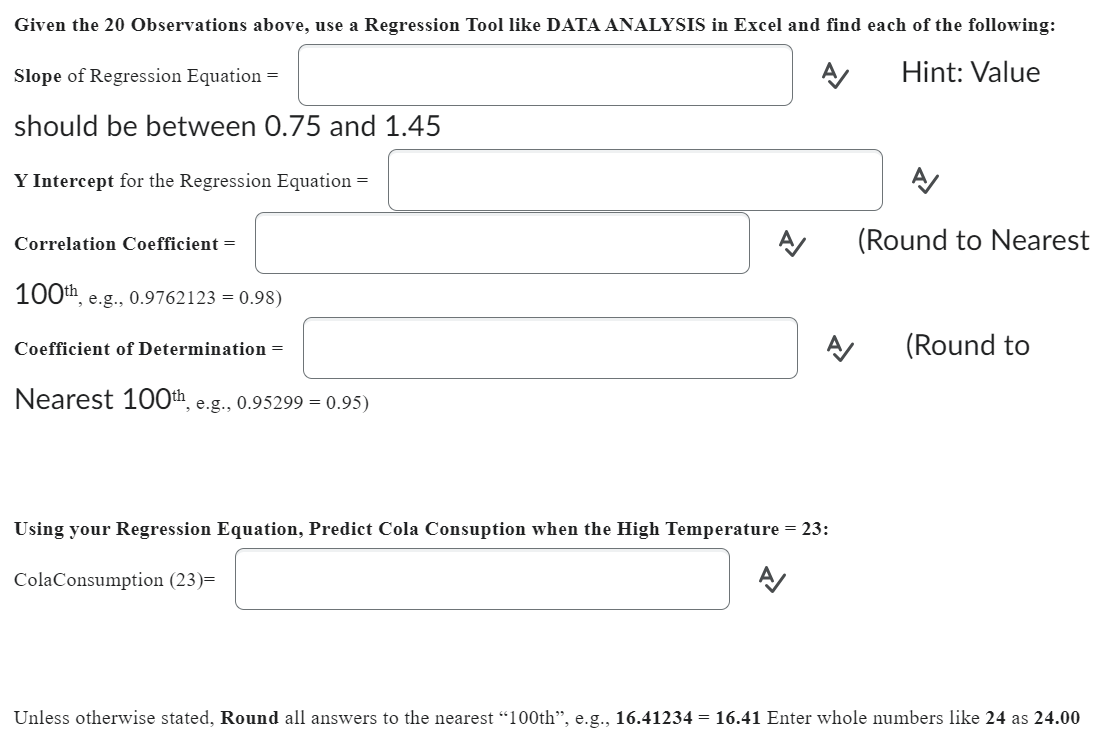
The following data were taken from a study relating the Days High Temperature to the Average Amount of Cola Consumed (per capita) in a small mid-western town. Given the 20 Observations above, use a Regression Tool like DATA ANALYSIS in Excel and find each of the following: Slope of Regression Equation = should be between 0.75 and 1.45 Y Intercept for the Regression Equation = A Correlation Coefficient = A (Round to Nearest 100th, e.g., 0.9762123=0.98 ) Coefficient of Determination = A) (Round to Nearest 100th,e.g., 0.95299=0.95 ) Using your Regression Equation, Predict Cola Consuption when the High Temperature = 23: ColaConsumption (23)= A \begin{tabular}{|c|c|c|} \hline Observation & Days High Temperature & Average Ounces of Cola Consumed \\ \hline 1 & 68 & 73 \\ \hline 2 & 77 & 61 \\ \hline 3 & 85 & 67 \\ \hline 4 & 96 & 83 \\ \hline 5 & 64 & 30 \\ \hline 6 & 80 & 56 \\ \hline 7 & 69 & 57 \\ \hline 8 & 59 & 53 \\ \hline 9 & 94 & 79 \\ \hline 10 & 90 & 79 \\ \hline 11 & 50 & 53 \\ \hline 12 & 59 & 47 \\ \hline 13 & 97 & 80 \\ \hline 14 & 82 & 64 \\ \hline 15 & 70 & 65 \\ \hline 16 & 104 & 80 \\ \hline 17 & 91 & 75 \\ \hline 18 & 99 & 101 \\ \hline 19 & 104 & 84 \\ \hline 20 & 98 & 91 \\ \hline \end{tabular}
Step by Step Solution
There are 3 Steps involved in it

Get step-by-step solutions from verified subject matter experts