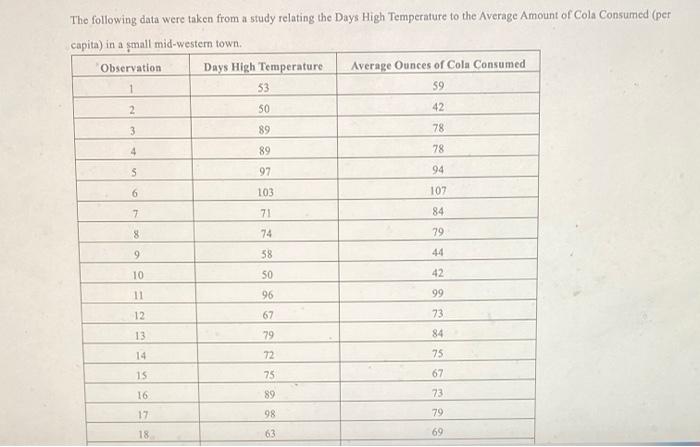
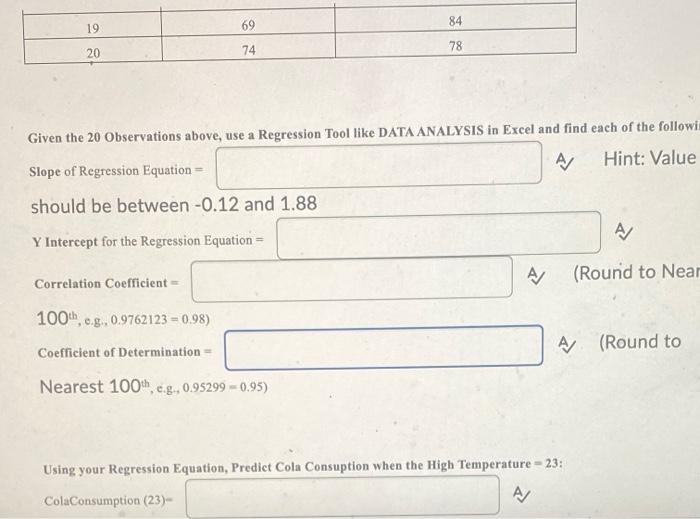
Question: The following data were taken from a study relating the Days High Temperature to the Average Amount of Cola Consumed (per capita) in a small

The following data were taken from a study
The following data were taken from a study relating the Days High Temperature to the Average Amount of Cola Consumed (per capita) in a small mid-western town. Observation Days High Temperature Average Ounces of Cola Consumed 1 53 59 2 SO 42 3 89 78 4 89 78 S 97 94 6 103 107 7 71 84 8 74 79 9 58 44 10 SO 42 11 96 99 12 67 73 13 79 84 14 72 75 15 75 67 16 89 73 17 98 79 18 63 69 19 69 84 20 74 78 Given the 20 Observations above, use a Regression Tool like DATA ANALYSIS in Excel and find each of the followi Slope of Regression Equation - A Hint: Value should be between -0.12 and 1.88 A/ Y Intercept for the Regression Equation = A Correlation Coefficient - (Round to Near 100th, c.8., 0.9762123 = 0.98) A (Round to Coefficient of Determination = Nearest 100th, c.9., 0.95299 -0.95) Using your Regression Equation, Predict Cola Consuption when the High Temperature - 23: ColaConsumption (23) A/

Step by Step Solution

There are 3 Steps involved in it

1 Expert Approved Answer
Step: 1 Unlock blur-text-image
Question Has Been Solved by an Expert!

Get step-by-step solutions from verified subject matter experts

Step: 2 Unlock
Step: 3 Unlock

Students Have Also Explored These Related General Management Questions!