

The following figure depicts an oxygen saturation curve of two mutant hemoglobins: hemoglobin A and hemoglobin B.
Question:
The following figure depicts an oxygen saturation curve of two mutant hemoglobins: hemoglobin A and hemoglobin B.
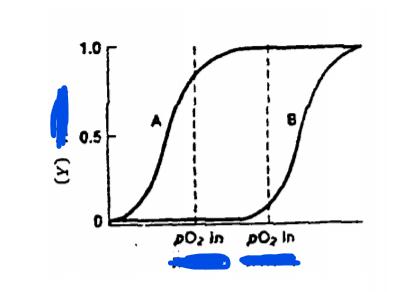
The Y-axis symbolizes saturation, the first dashed line on the left symbolizes the tissues and then on the right the lungs.
A. Determine for each of the mutations, if the transfer of oxygen from the lungs to the tissues is impaired. Explain your determination by comparing it to normal hemoglobin.
B. Would connecting an animal to an oxygen balloon affect the transfer of oxygen from the lungs to the tissues? In your answer, refer to each of the mutants.
C. In an attempt to find an explanation for these mutations, it has been hypothesized that the affinities of mutant hemoglobin to BPG are different from the affinities of normal hemoglobin to BPG. We examined this hypothesis regarding the two mutants.
Expert Answer:
and as we know pH ia decreases The taut form predominates within the tissues a high CO2 low pH environment promoting oxygen release whereas the relaxed form binds oxygen more avidly in areas of high p... View the full answer


Mathematical Applications for the Management Life and Social Sciences
ISBN: 978-1305108042
11th edition
Authors: Ronald J. Harshbarger, James J. Reynolds
