

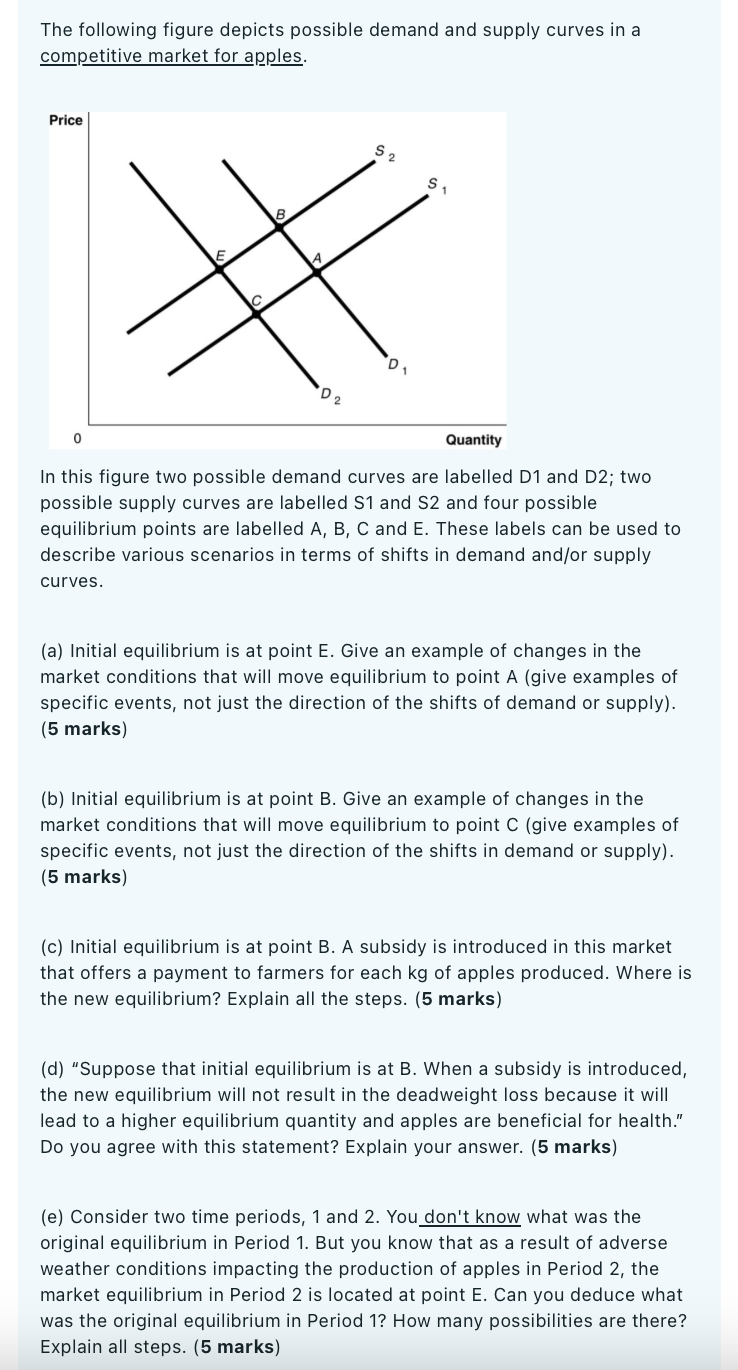
The following figure depicts possible demand and supply curves in a competitive market for apples. Price...
Fantastic news! We've Found the answer you've been seeking!
Question:
Expert Answer:
a To move the equilibrium from point E to point A there could be several changes in market conditions For example A decrease in consumer income If there is a recession or a decrease in consumer purcha... View the full answer

Related Book For 

Macroeconomics Principles And Policy
ISBN: 9780324586213
11th Edition
Authors: William J. Baumol, Alan S. Blinder
Posted Date:
