

Question: The following figure is a brief answer, please explain the meaning of each formula in detail. 17.4-7. Consider a two-server queueing system where all service
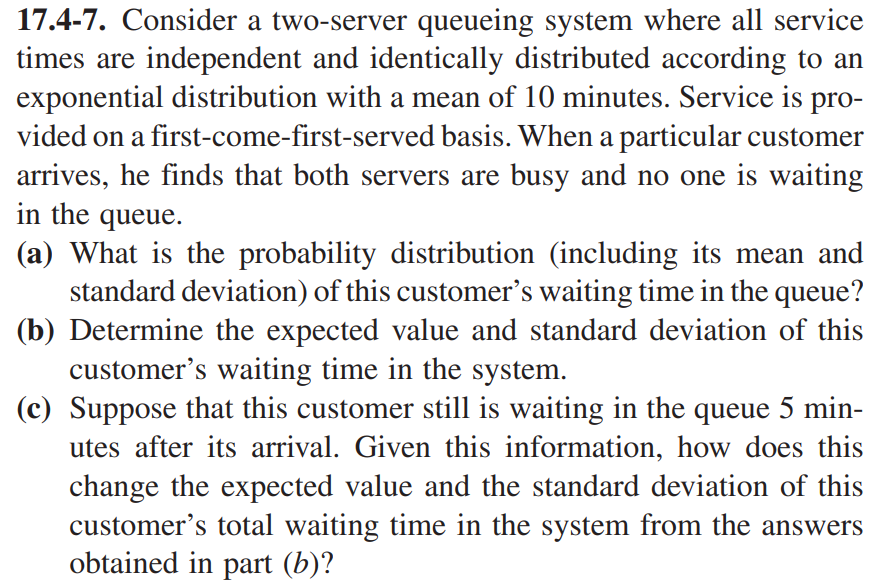
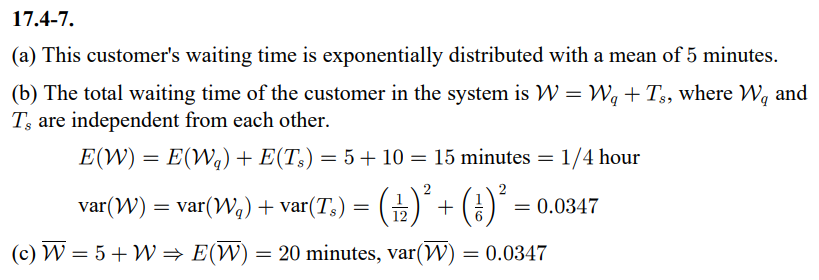
The following figure is a brief answer, please explain the meaning of each formula in detail.
Step by Step Solution
There are 3 Steps involved in it
1 Expert Approved Answer
Step: 1 Unlock

Question Has Been Solved by an Expert!
Get step-by-step solutions from verified subject matter experts
Step: 2 Unlock
Step: 3 Unlock