

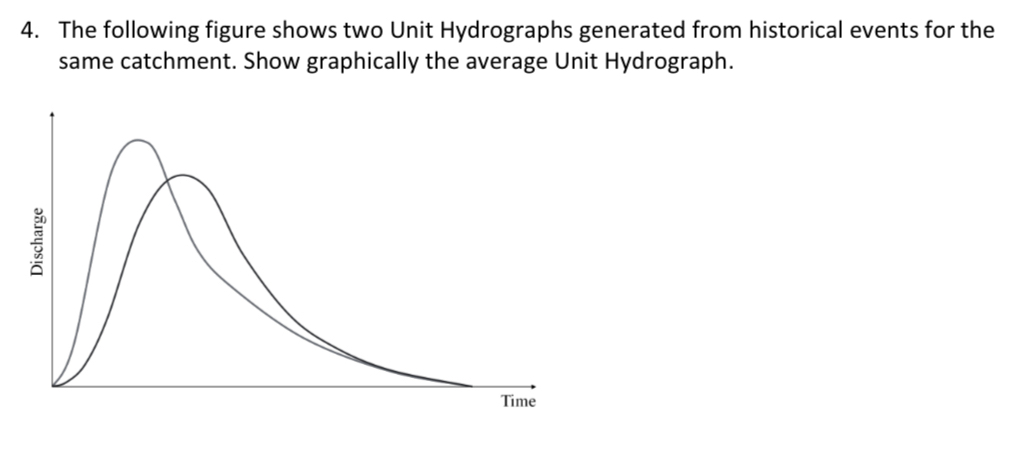
Question: The following figure shows two Unit Hydrographs generated from historical events for the same catchment. Show graphically the average Unit Hydrograph.
The following figure shows two Unit Hydrographs generated from historical events for the same catchment. Show graphically the average Unit Hydrograph.
Step by Step Solution
There are 3 Steps involved in it
1 Expert Approved Answer
Step: 1 Unlock

Question Has Been Solved by an Expert!
Get step-by-step solutions from verified subject matter experts
Step: 2 Unlock
Step: 3 Unlock