

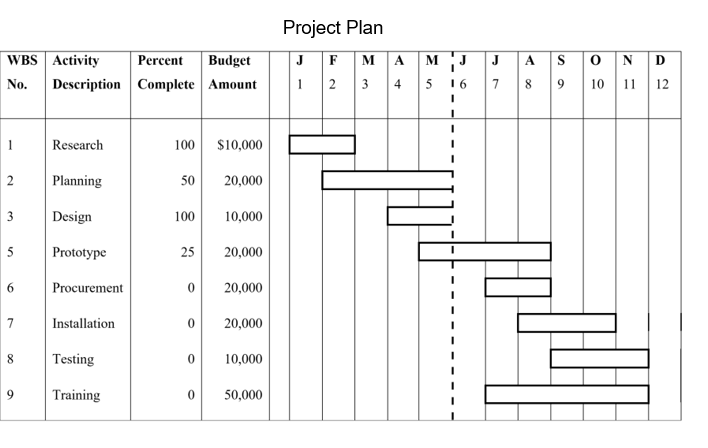
Question: The following Gantt chart represents the rough project plan for the development of a web portal. Each task has been scheduled to begin at the
The following Gantt chart represents the rough project plan for the development of a web portal. Each task has been scheduled to begin at the beginning of a month, and be completed at the end of a month, as indicated by the bold timeline bars (assume that all months are of equal length). The project manager has entered the percent complete for each activity, as shown below, but has not indicated the status graphically on the task bars. Assume today is June 1 and so far all activities have started on time, and the project is on budget for the work that has been performed so far. Assume payments are made at the end of each month for the work that was performed.
Step by Step Solution
There are 3 Steps involved in it

Get step-by-step solutions from verified subject matter experts