

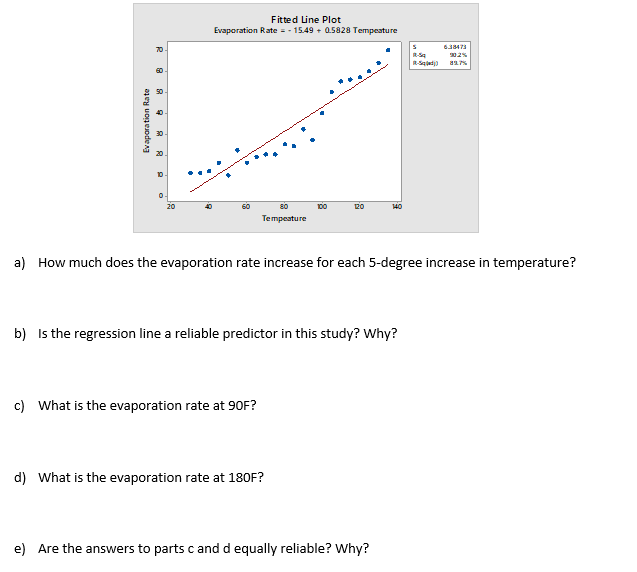
Question: The following graph represents a scatter plot and the linear regression line for an experiment involving the evaporation rate of a fluid at various temperatures.
The following graph represents a scatter plot and the linear regression line for an experiment involving the evaporation rate of a fluid at various temperatures. Note the equation and the information provided on the graph.
\f
Step by Step Solution
There are 3 Steps involved in it
1 Expert Approved Answer
Step: 1 Unlock

Question Has Been Solved by an Expert!
Get step-by-step solutions from verified subject matter experts
Step: 2 Unlock
Step: 3 Unlock