

Question: The following graph shows the approximate value V ( t ) of subprime ( normally classified as risky ) mortgage debt outstanding in the United
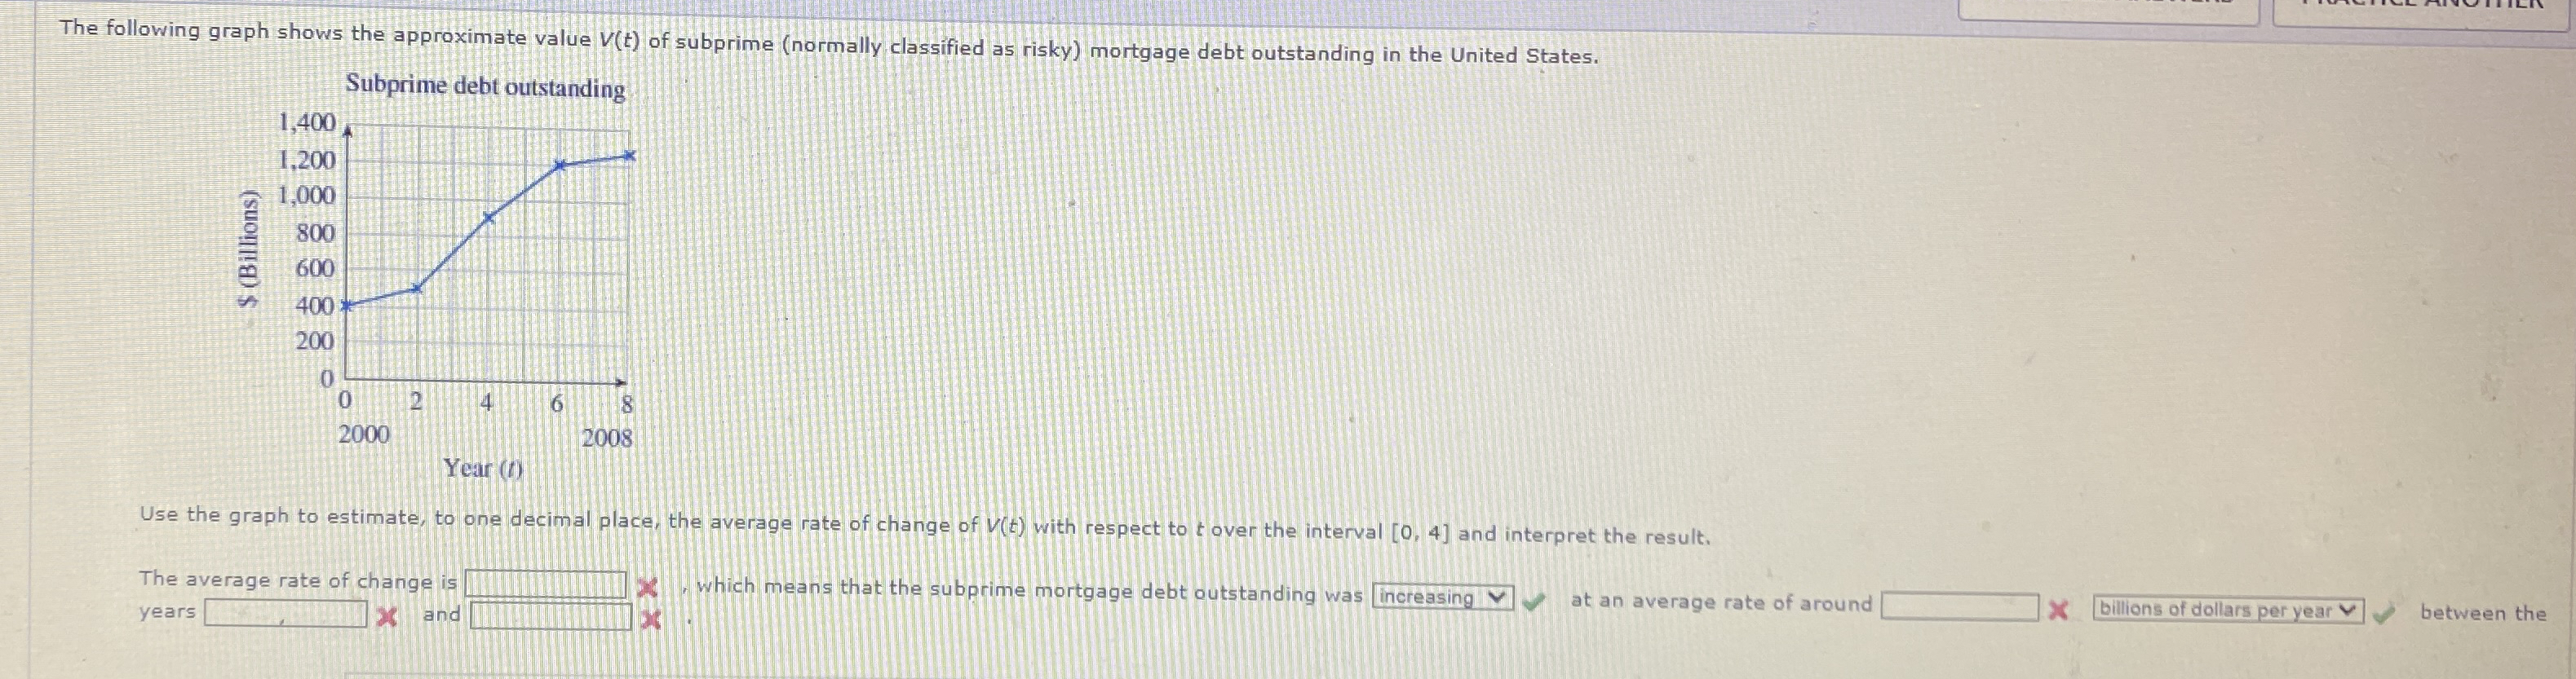
The following graph shows the approximate value of subprime normally classified as risky mortgage debt outstanding in the United States.
Use the graph to estimate, to one decimal place, the average rate of change of with respect to over the interval and interpret the result.
The average rate of change is years ans which means that the subprime mortgage debt outstanding was increasing at an average rate of around
billions of dollars per year
between the
Step by Step Solution
There are 3 Steps involved in it
1 Expert Approved Answer
Step: 1 Unlock

Question Has Been Solved by an Expert!
Get step-by-step solutions from verified subject matter experts
Step: 2 Unlock
Step: 3 Unlock