

Question: The following graph visualizes the expected throughput for processes when the degree of multitasking is increased. For and 3 in the graph, technically describe how
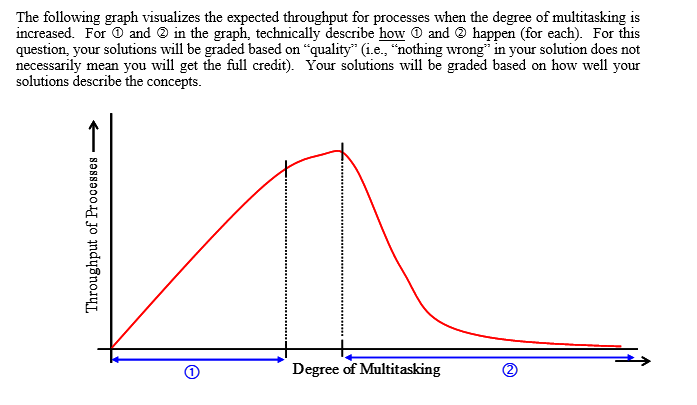
The following graph visualizes the expected throughput for processes when the degree of multitasking is increased. For and 3 in the graph, technically describe how O and happen (for each). For this question, your solutions will be graded based on "quality" (i.e., "nothing wrong" n your solution does not necessarily mean you will get the full credit). Your solutions will be graded based on how well your solutions describe the concepts Degree of Multitasking
Step by Step Solution
There are 3 Steps involved in it
1 Expert Approved Answer
Step: 1 Unlock

Question Has Been Solved by an Expert!
Get step-by-step solutions from verified subject matter experts
Step: 2 Unlock
Step: 3 Unlock