

Question: The following graphs are derived using CAPM method based on price information of AT&T and Verizon from Jan 31, 2019 to Jan 30, 2020
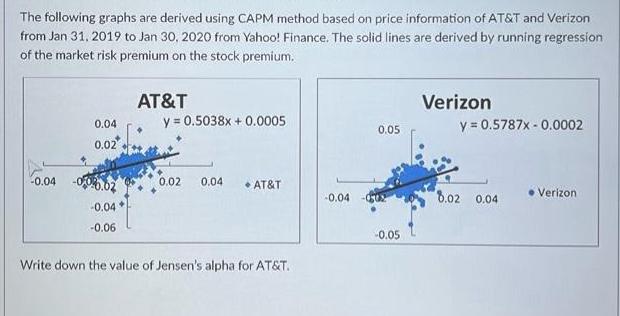
The following graphs are derived using CAPM method based on price information of AT&T and Verizon from Jan 31, 2019 to Jan 30, 2020 from Yahoo! Finance. The solid lines are derived by running regression of the market risk premium on the stock premium. -0.04 0.04 0.02 06.02 -0.04 -0.06 AT&T y = 0.5038x + 0.0005 0.02 0.04 AT&T Write down the value of Jensen's alpha for AT&T. -0.04 0.05 -0.05 Verizon y = 0.5787x -0.0002 8.02 0.04 Verizon Based on the information of Question 18, is Verizon alone a good investment? Edit View Insert Format Tools Table 12pt Paragraph BIUA 2 T 00 [12] > & V 0 words **** ts rix Based on the information of Question 18, use market neutral and pair trading strategy, and the two stocks alpha and raw beta values, decide how to allocate your wealth on these two stocks to achieve a successful market neutral portfolio. Please show all your work. Edit View Insert Format Tools Table. 12pt Paragraph | B IU A 18 -T v 00. > > & A
Step by Step Solution
3.52 Rating (159 Votes )
There are 3 Steps involved in it
Here are the stepbystep workings to calculate Jensens alpha for ATT 1 The regression e... View full answer

Get step-by-step solutions from verified subject matter experts