

Question: The following information is from FACTSET comparing a hypothetical Value Fund to S&P 500 Value ETF. Value Fund Total Percentage return = 11.82%% iShares S&P
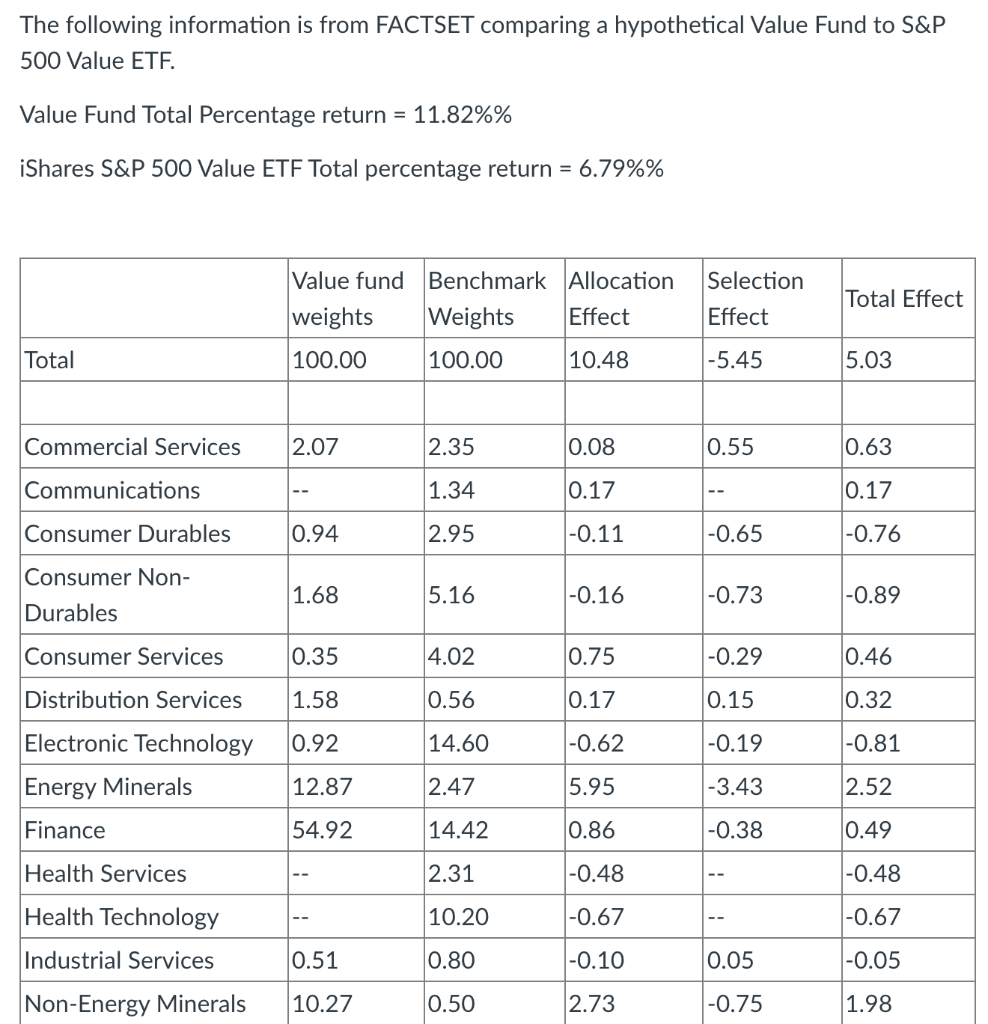
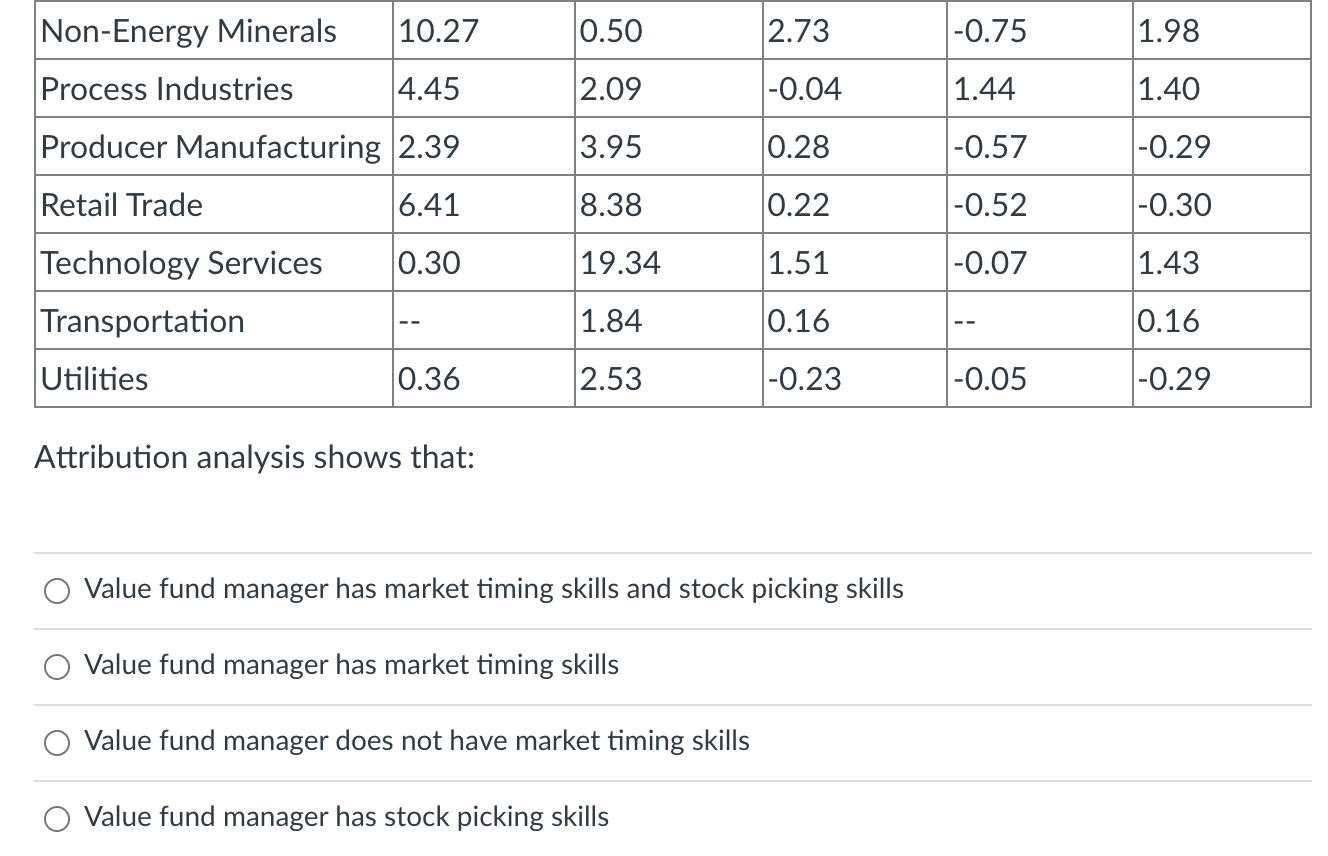
The following information is from FACTSET comparing a hypothetical Value Fund to S&P 500 Value ETF. Value Fund Total Percentage return = 11.82%% iShares S&P 500 Value ETF Total percentage return = 6.79%% Value fund Benchmark Allocation Selection Total Effect weights Weights Effect Effect Total 100.00 100.00 10.48 -5.45 5.03 Commercial Services 2.07 2.35 0.08 0.55 10.63 Communications 1.34 0.17 0.17 -- Consumer Durables 0.94 2.95 -0.11 -0.65 -0.76 Consumer Non- 1.68 5.16 -0.16 -0.73 -0.89 Durables Consumer Services 0.35 4.02 0.75 -0.29 0.46 Distribution Services 1.58 0.56 0.17 0.15 0.32 Electronic Technology 0.92 14.60 -0.62 -0.19 -0.81 Energy Minerals 12.87 2.47 5.95 -3.43 2.52 Finance 54.92 14.42 0.86 -0.38 0.49 Health Services 2.31 -0.48 -0.48 Health Technology 10.20 -0.67 |-- -0.67 Industrial Services 0.51 0.80 -0.10 0.05 -0.05 Non-Energy Minerals 10.27 0.50 2.73 -0.75 1.98 Non-Energy Minerals 10.27 0.50 2.73 Process Industries 4.45 2.09 -0.04 Producer Manufacturing 2.39 3.95 0.28 Retail Trade 6.41 8.38 0.22 Technology Services 0.30 19.34 1.51 Transportation 1.84 0.16 Utilities 0.36 2.53 -0.23 Attribution analysis shows that: Value fund manager has market timing skills and stock picking skills Value fund manager has market timing skills Value fund manager does not have market timing skills Value fund manager has stock picking skills -0.75 1.44 -0.57 -0.52 -0.07 -0.05 1.98 1.40 -0.29 -0.30 1.43 0.16 -0.29 The following information is from FACTSET comparing a hypothetical Value Fund to S&P 500 Value ETF. Value Fund Total Percentage return = 11.82%% iShares S&P 500 Value ETF Total percentage return = 6.79%% Value fund Benchmark Allocation Selection Total Effect weights Weights Effect Effect Total 100.00 100.00 10.48 -5.45 5.03 Commercial Services 2.07 2.35 0.08 0.55 10.63 Communications 1.34 0.17 0.17 -- Consumer Durables 0.94 2.95 -0.11 -0.65 -0.76 Consumer Non- 1.68 5.16 -0.16 -0.73 -0.89 Durables Consumer Services 0.35 4.02 0.75 -0.29 0.46 Distribution Services 1.58 0.56 0.17 0.15 0.32 Electronic Technology 0.92 14.60 -0.62 -0.19 -0.81 Energy Minerals 12.87 2.47 5.95 -3.43 2.52 Finance 54.92 14.42 0.86 -0.38 0.49 Health Services 2.31 -0.48 -0.48 Health Technology 10.20 -0.67 |-- -0.67 Industrial Services 0.51 0.80 -0.10 0.05 -0.05 Non-Energy Minerals 10.27 0.50 2.73 -0.75 1.98 Non-Energy Minerals 10.27 0.50 2.73 Process Industries 4.45 2.09 -0.04 Producer Manufacturing 2.39 3.95 0.28 Retail Trade 6.41 8.38 0.22 Technology Services 0.30 19.34 1.51 Transportation 1.84 0.16 Utilities 0.36 2.53 -0.23 Attribution analysis shows that: Value fund manager has market timing skills and stock picking skills Value fund manager has market timing skills Value fund manager does not have market timing skills Value fund manager has stock picking skills -0.75 1.44 -0.57 -0.52 -0.07 -0.05 1.98 1.40 -0.29 -0.30 1.43 0.16 -0.29
Step by Step Solution
There are 3 Steps involved in it

Get step-by-step solutions from verified subject matter experts