

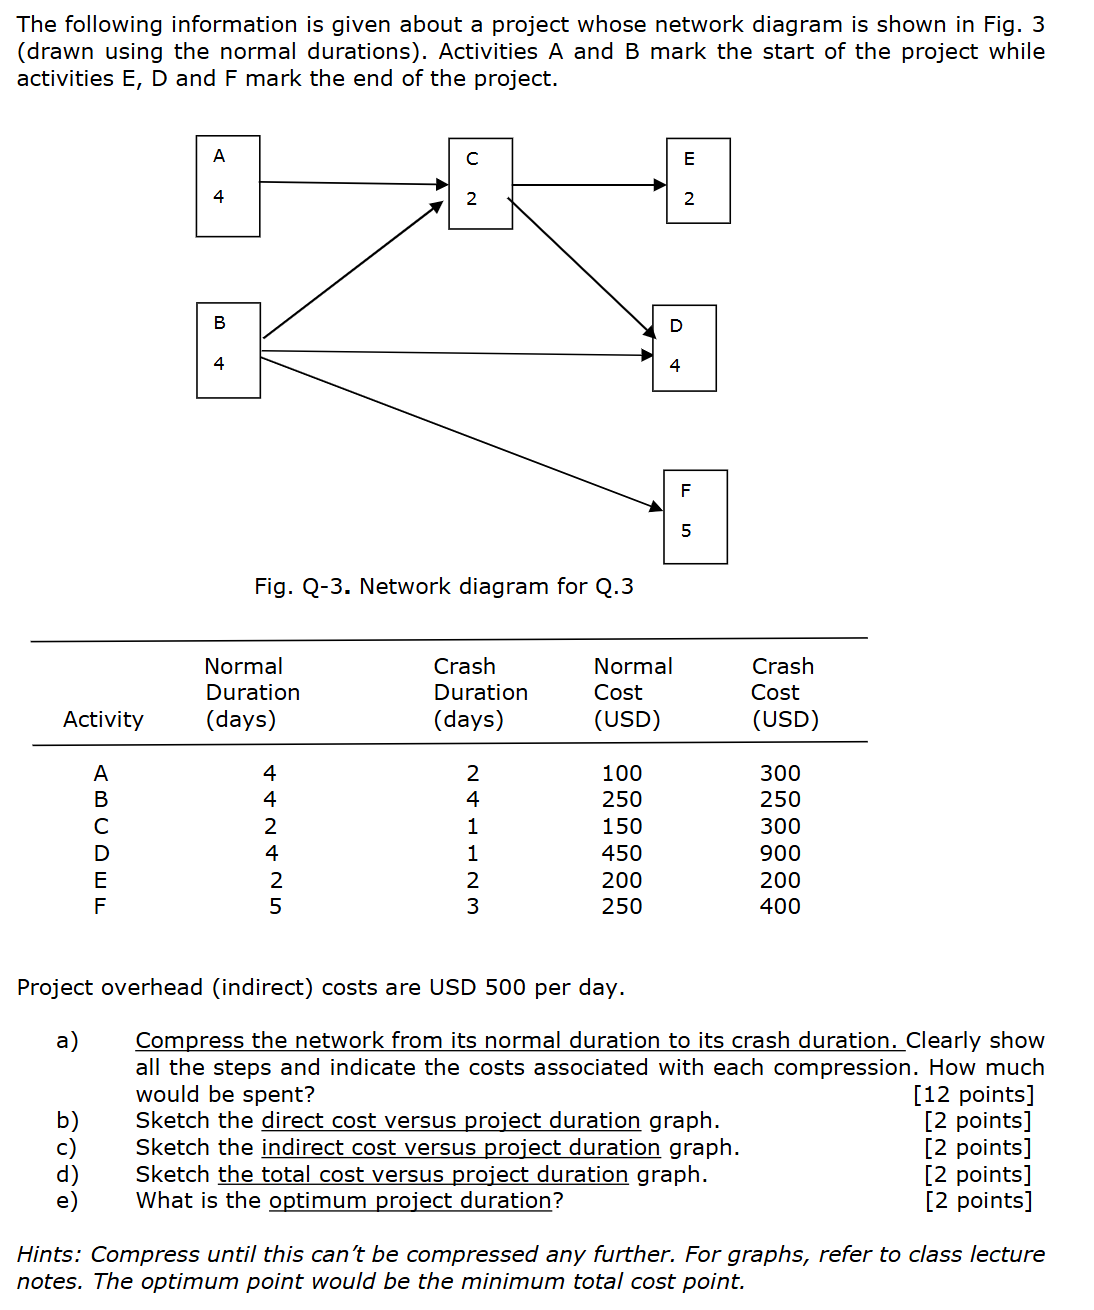
Question: The following information is given about a project whose network diagram is shown in Fig. 3 ( drawn using the normal durations ) . Activities
The following information is given about a project whose network diagram is shown in Fig. drawn using the normal durations Activities A and B mark the start of the project while activities E D and F mark the end of the project.
Project overhead indirect costs are USD per day.
a Compress the network from its normal duration to its crash duration. Clearly show all the steps and indicate the costs associated with each compression. How much would be spent?
points
b Sketch the direct cost versus project duration graph.
c Sketch the indirect cost versus project duration graph.
d Sketch the total cost versus project duration graph.
e What is the optimum project duration?
Hints: Compress until this can't be compressed any further. For graphs, refer to class lecture notes. The optimum point would be the minimum total cost point.
Step by Step Solution
There are 3 Steps involved in it
1 Expert Approved Answer
Step: 1 Unlock

Question Has Been Solved by an Expert!
Get step-by-step solutions from verified subject matter experts
Step: 2 Unlock
Step: 3 Unlock