

Question: The following is a plot for the sales data for the past 30 weeks for product X (Blue curve). It also has two curves that
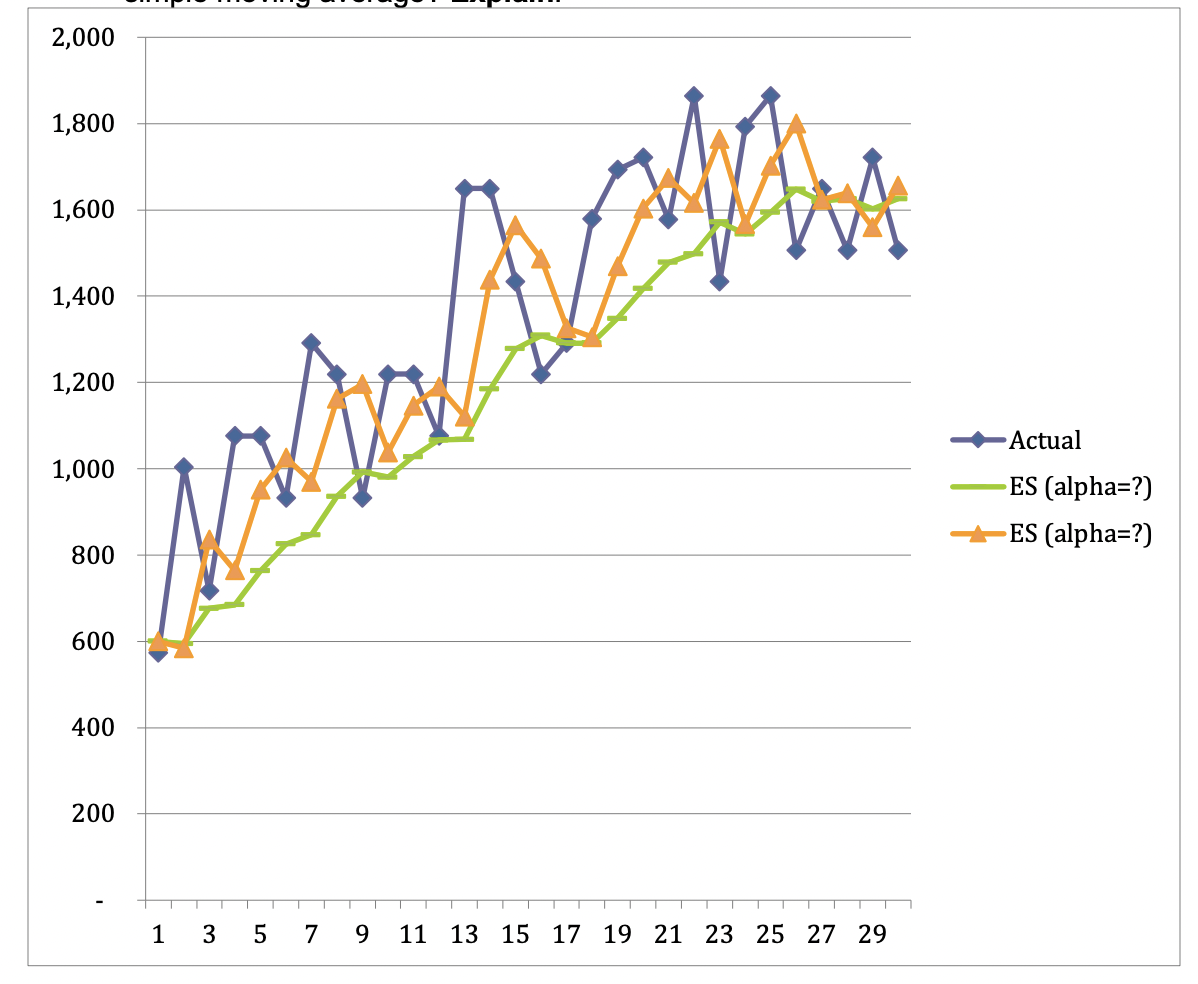
The following is a plot for the sales data for the past 30 weeks for product X (Blue curve). It also has two curves that represent the forecasted data. Based on the plot, answer the following questions (For each question, you must explain the reason for your answer; otherwise, you will only receive partial credits) a. The two forecasts were made using exponential smoothing method with different parameters. One is with value of = 0.2 and the other is with value = 0.6. Just by looking at the plot, tell which curve is for which exponential smoothing parameter. Explain. b. Now, lets say that we are about to use moving average to do the forecasts. We can choose to do a 3-week or a 6-week simple moving average. Which one do you think will be a better forecast? Explain. c. If we only look at the last five weeks (i.e., from week 26 to week 30, or, the last five points in the plot), will you change your answer to (b)? In other words, if we only compare the two forecasts for the last five weeks, which one is more likely to result in smaller MAD, 3-week or 6-week simple moving average? Explain.
Step by Step Solution
There are 3 Steps involved in it

Get step-by-step solutions from verified subject matter experts