

Question: The following is a position-time graph for a body moving with a constant velocity. x(m) a. Create a brief story that can explain the motion
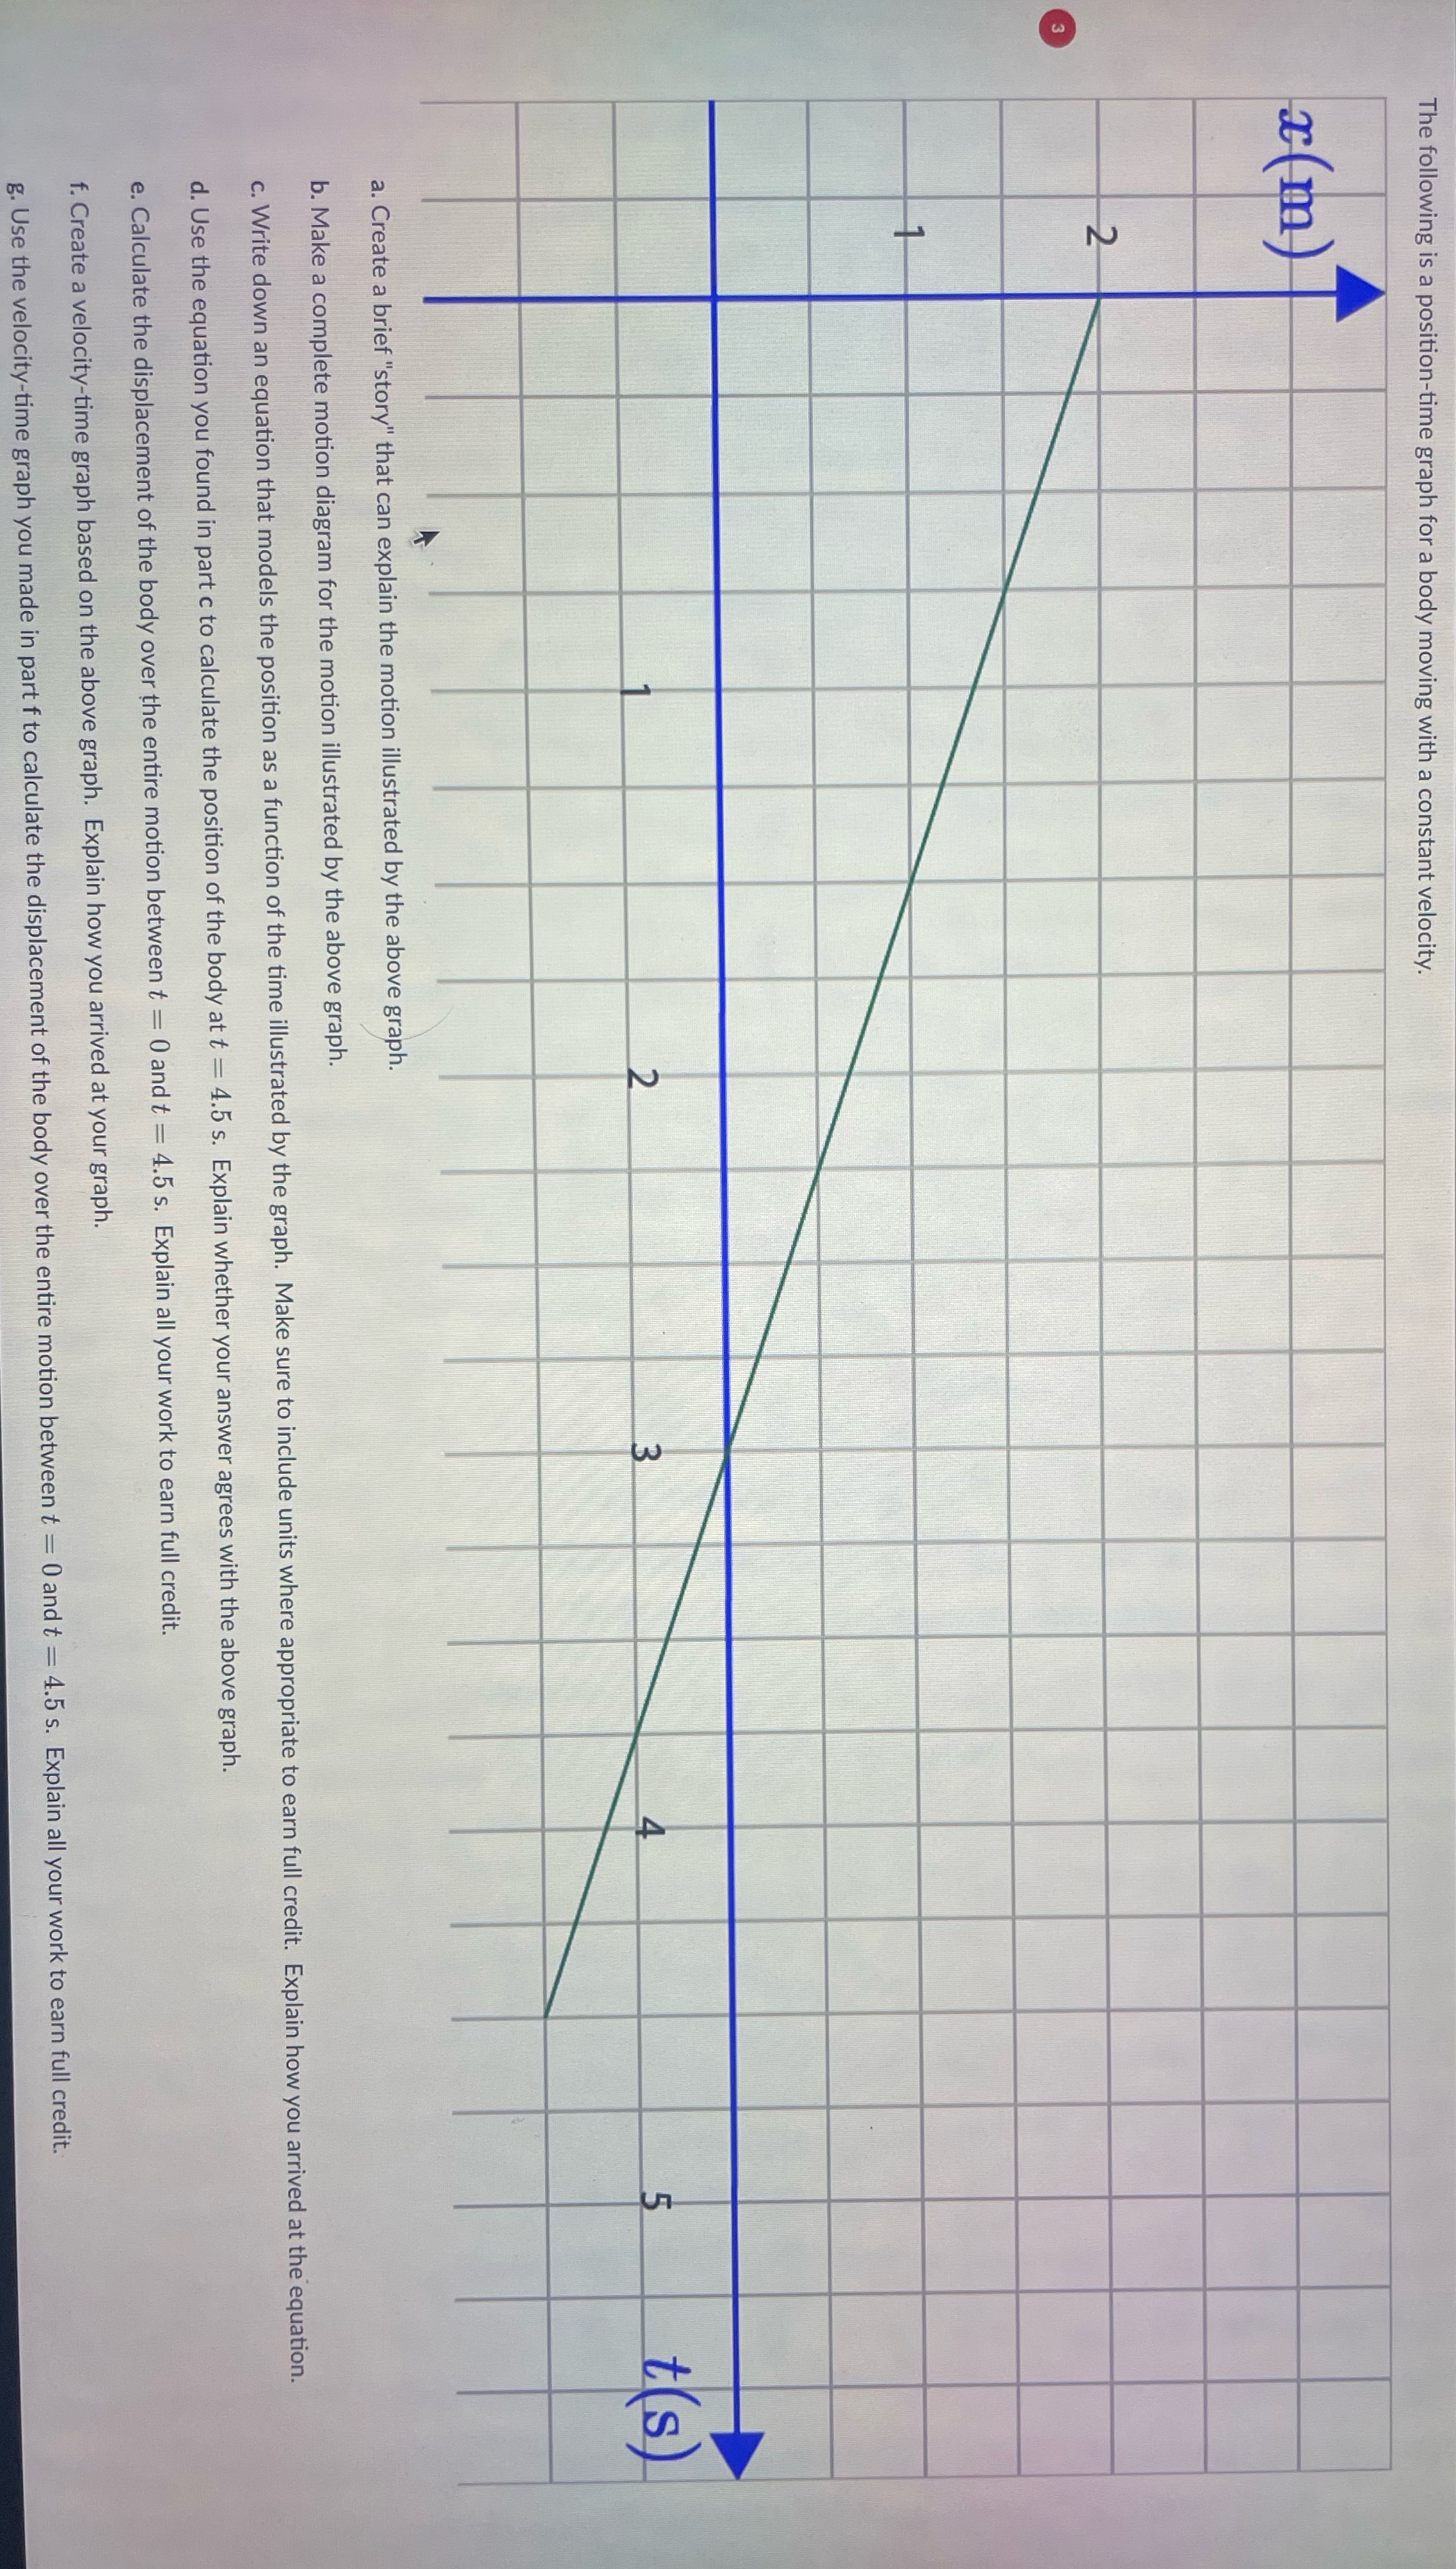
The following is a position-time graph for a body moving with a constant velocity. x(m) a. Create a brief "story" that can explain the motion illustrated by the above graph. b. Make a complete motion diagram for the motion illustrated by the above graph. c. Write down an equation that models the position as a function of the time illustrated by the graph. Make sure to include units where appropriate to earn full credit. Explain how you arrived at the equation. d. Use the equation you found in part c to calculate the position of the body at t = 4.5 s. Explain whether your answer agrees with the above graph. e. Calculate the displacement of the body over the entire motion between t = 0 and t = 4.5 s. Explain all your work to earn full credit. f. Create a velocity-time graph based on the above graph. Explain how you arrived at your graph. g. Use the velocity-time graph you made in part f to calculate the displacement of the body over the entire motion between t = 0 and t = 4.5 s. Explain all your work to earn full credit
Step by Step Solution
There are 3 Steps involved in it

Get step-by-step solutions from verified subject matter experts