

Question: The following MATLAB statements plot the function y ( x ) = 4 e - 0 . 3 x for the range 0 x 1
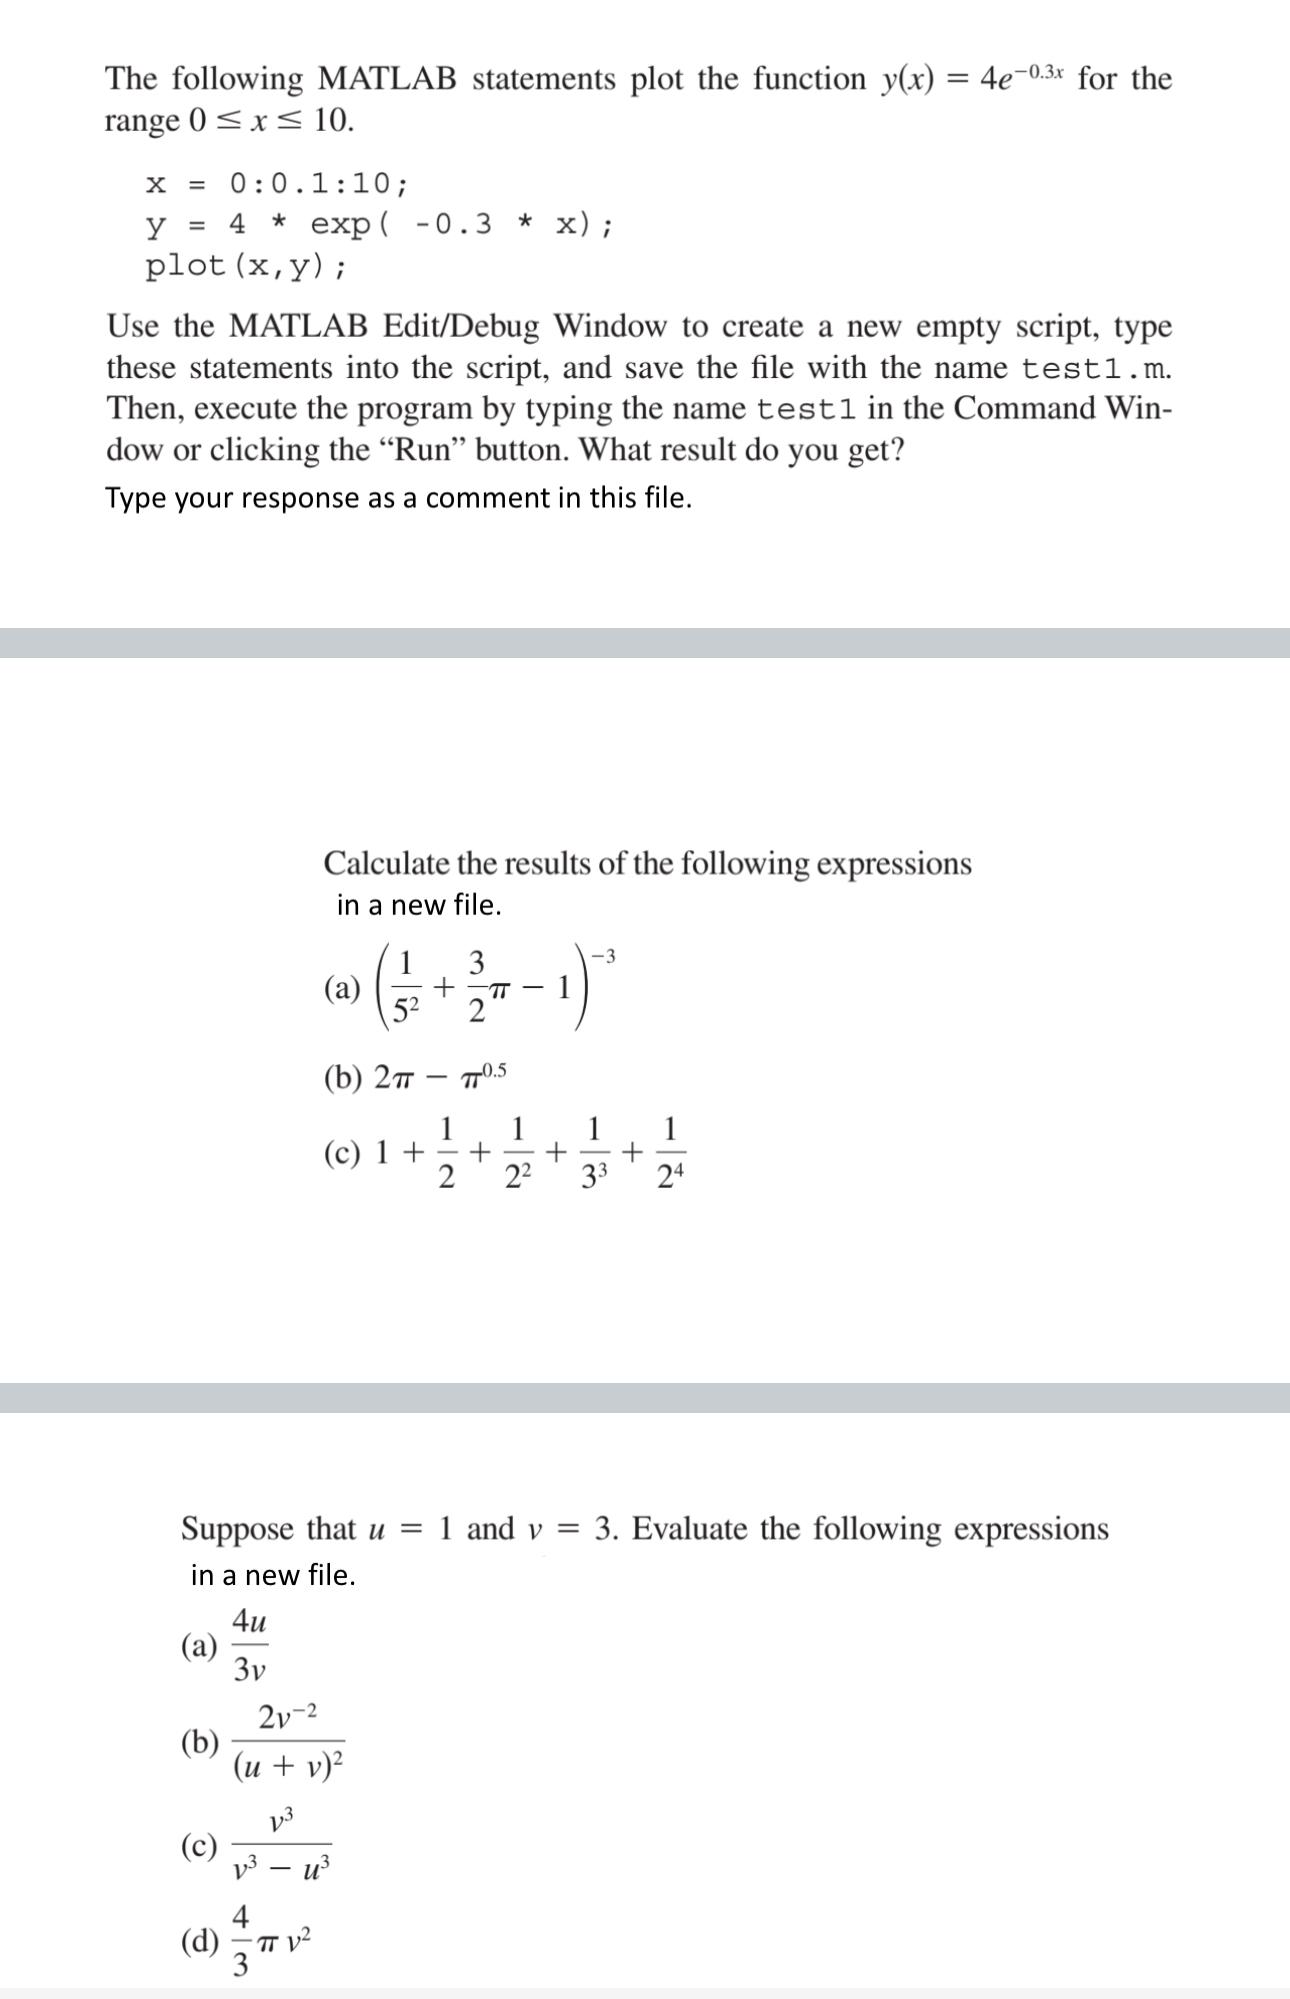
The following MATLAB statements plot the function for the range
::;
;
plot;
Use the MATLAB EditDebug Window to create a new empty script, type these statements into the script, and save the file with the name test Then, execute the program by typing the name test in the Command Window or clicking the "Run" button. What result do you get?
Type your response as a comment in this file.
Calculate the results of the following expressions in a new file.
a
b
c
Suppose that and Evaluate the following expressions in a new file.
a
b
c
d
Step by Step Solution
There are 3 Steps involved in it
1 Expert Approved Answer
Step: 1 Unlock

Question Has Been Solved by an Expert!
Get step-by-step solutions from verified subject matter experts
Step: 2 Unlock
Step: 3 Unlock