

Question: The following pattern in a reactor is evaluated by determining the residence time distribution function ( E ) . Below are the results obtained for
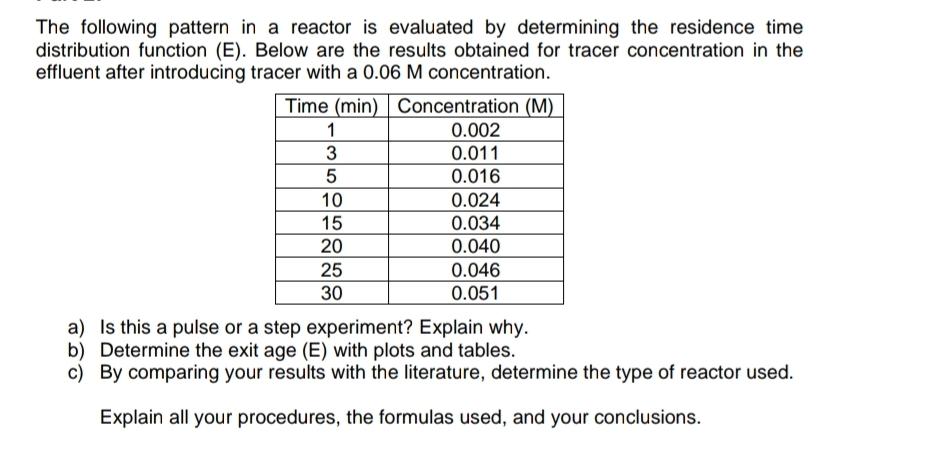
The following pattern in a reactor is evaluated by determining the residence time distribution function E Below are the results obtained for tracer concentration in the effluent after introducing tracer with a concentration.
tableTime minConcentration M
a Is this a pulse or a step experiment? Explain why.
b Determine the exit age with plots and tables.
c By comparing your results with the literature, determine the type of reactor used.
Explain all your procedures, the formulas used, and your conclusions.
Step by Step Solution
There are 3 Steps involved in it
1 Expert Approved Answer
Step: 1 Unlock

Question Has Been Solved by an Expert!
Get step-by-step solutions from verified subject matter experts
Step: 2 Unlock
Step: 3 Unlock