

Question: The following plot shows the estimated single-index model (blue line) from a sample of data points (black dots) of the excess returns on a stock
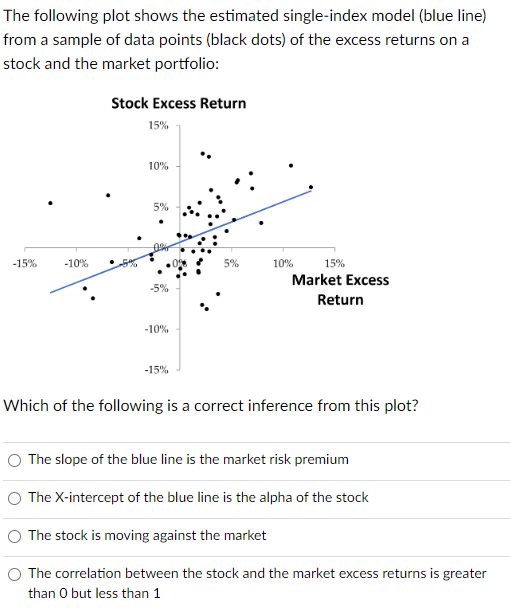
The following plot shows the estimated single-index model (blue line) from a sample of data points (black dots) of the excess returns on a stock and the market portfolio: Stock Excess Return 15% 10% 5% OM -15% -10% 5% -5% 10% 15% Market Excess Return -10% -15% Which of the following is a correct inference from this plot? The slope of the blue line is the market risk premium The X-intercept of the blue line is the alpha of the stock The stock is moving against the market The correlation between the stock and the market excess returns is greater than 0 but less than 1
Step by Step Solution
There are 3 Steps involved in it
1 Expert Approved Answer
Step: 1 Unlock

Question Has Been Solved by an Expert!
Get step-by-step solutions from verified subject matter experts
Step: 2 Unlock
Step: 3 Unlock