

Question: The following plot shows the function x2 + 5x + 6 over the range-2.8 0 x Graph of Y vs. X 2.5 0.5 0.5 2.5
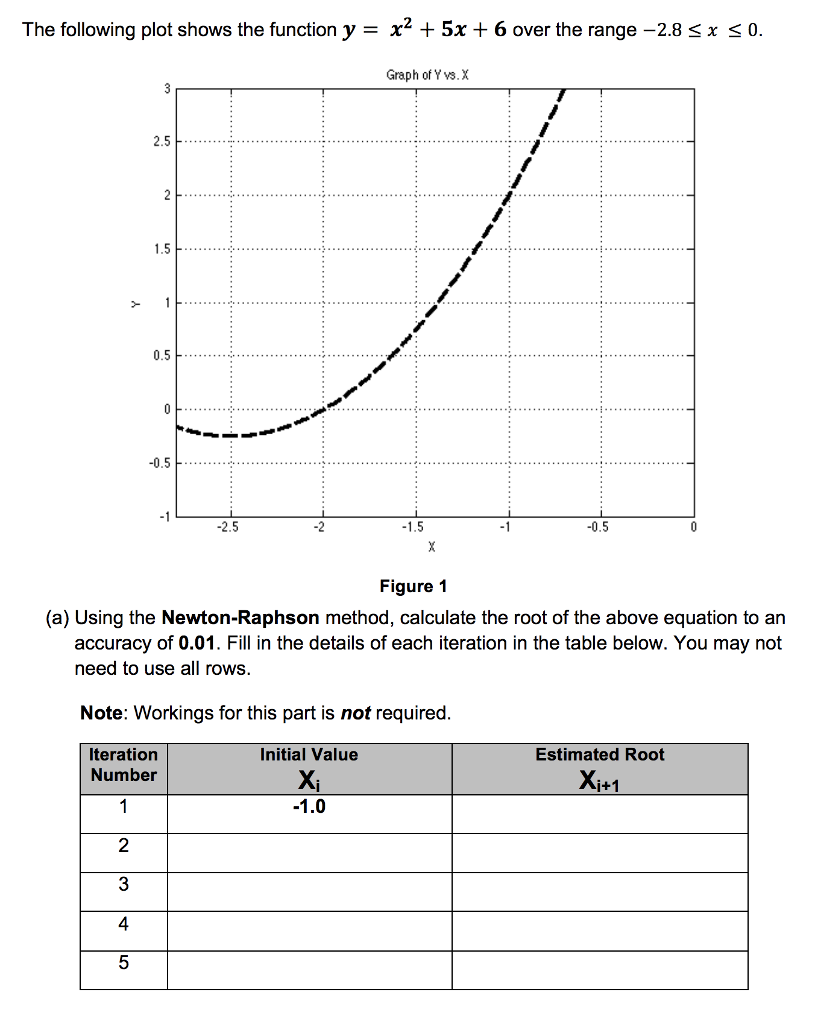
The following plot shows the function x2 + 5x + 6 over the range-2.8 0 x Graph of Y vs. X 2.5 0.5 0.5 2.5 Figure 1 (a) Using the Newton-Raphson method, calculate the root of the above equation to an accuracy of 0.01. Fill in the details of each iteration in the table below. You may not need to use all rows Note: Workings for this part is not required Iteration Number Initial Value Estimated Root Xi 2 3 4
Step by Step Solution
There are 3 Steps involved in it
1 Expert Approved Answer
Step: 1 Unlock

Question Has Been Solved by an Expert!
Get step-by-step solutions from verified subject matter experts
Step: 2 Unlock
Step: 3 Unlock