

Question: The following plot was acquired for data from a hydrogen lamp spectrum, and plotted according to the Rydberg equation below. 1=(n1)2RH+(n2)2RH What is the slope
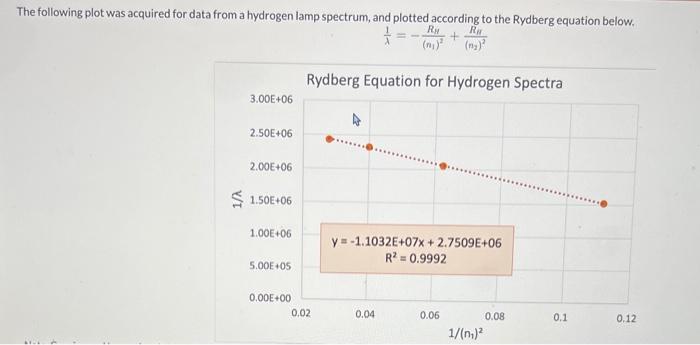
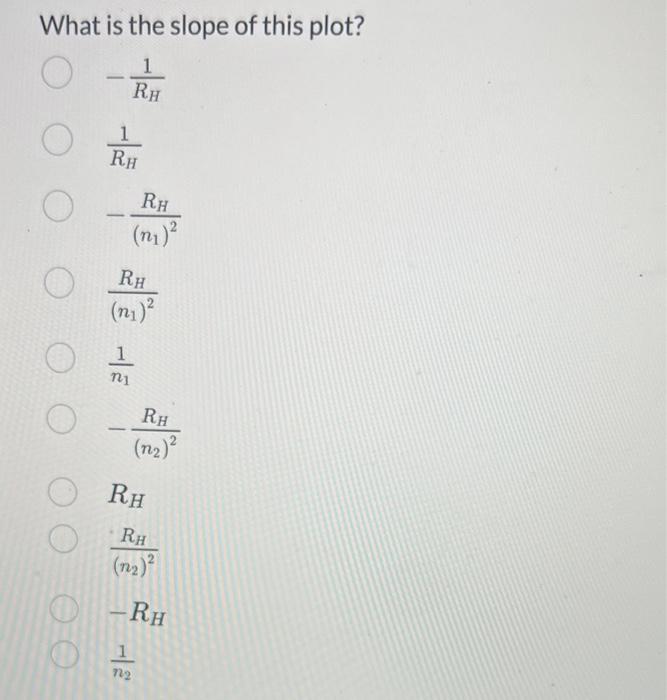
The following plot was acquired for data from a hydrogen lamp spectrum, and plotted according to the Rydberg equation below. 1=(n1)2RH+(n2)2RH What is the slope of this plot? RH1RH1(n1)2RH(n1)2RHn11(n2)2RHRH(n2)2RHRHn21
Step by Step Solution
There are 3 Steps involved in it
1 Expert Approved Answer
Step: 1 Unlock

Question Has Been Solved by an Expert!
Get step-by-step solutions from verified subject matter experts
Step: 2 Unlock
Step: 3 Unlock