

Question: Please use either Excel or MATLAB, and have a copy or a picture of the graph and the equation used and how to create what
Please use either Excel or MATLAB, and have a copy or a picture of the graph and the equation used and how to create what is required. thank you.
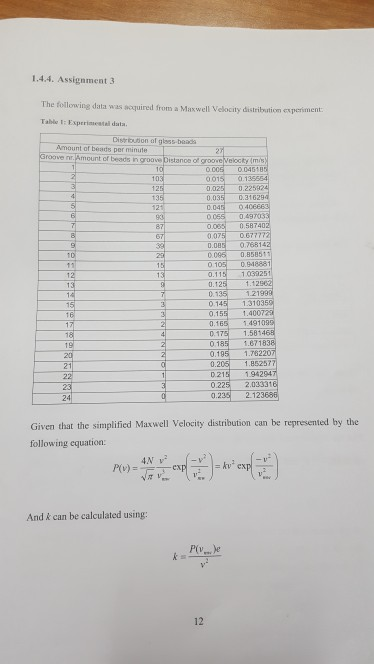
1.4.4. Assignment 3 The following data was acquired from Maxwell Velocity distribution experiment Tablet Experienta data Distribution of glass beads Amount of beads per minute mount of in groove Distance of gro 0.005 0015 o t mis 0.045185 0.135564 0.035 0.040 0.065 NSSON 0075 0.08 0.095 0 105 oltre alla 0.31629 0406EES 0.497033 0587402 0677772 0.768142 0.858511 0.048881 1032251 1.12962 0.125 1.21999 0.145 9.155 1.310350 1.400725 1491090 0.165 1581468 N D.175 0 185 0.195 0.205 1.215 0.225 0.238 1671838 1.762207 1.852577 1942047 2.033316 2123686 Given that the simplified Maxwell Velocity distribution can be represented by the following equation: Pow er And k can be calculated using: * Please With v : the velocity. Vw: the maximum velocity - defined as the velocity at maximum amount of beads P(Vmw): the maximum amount of beads in the distribution sections. 1. Plot a histogram of the distribution of the beads per groove. 2. Fit a Maxwell Velocity distribution curve using the experimental data to the histogram. 1.4.4. Assignment 3 The following data was acquired from Maxwell Velocity distribution experiment Tablet Experienta data Distribution of glass beads Amount of beads per minute mount of in groove Distance of gro 0.005 0015 o t mis 0.045185 0.135564 0.035 0.040 0.065 NSSON 0075 0.08 0.095 0 105 oltre alla 0.31629 0406EES 0.497033 0587402 0677772 0.768142 0.858511 0.048881 1032251 1.12962 0.125 1.21999 0.145 9.155 1.310350 1.400725 1491090 0.165 1581468 N D.175 0 185 0.195 0.205 1.215 0.225 0.238 1671838 1.762207 1.852577 1942047 2.033316 2123686 Given that the simplified Maxwell Velocity distribution can be represented by the following equation: Pow er And k can be calculated using: * Please With v : the velocity. Vw: the maximum velocity - defined as the velocity at maximum amount of beads P(Vmw): the maximum amount of beads in the distribution sections. 1. Plot a histogram of the distribution of the beads per groove. 2. Fit a Maxwell Velocity distribution curve using the experimental data to the histogram
Step by Step Solution
There are 3 Steps involved in it

Get step-by-step solutions from verified subject matter experts