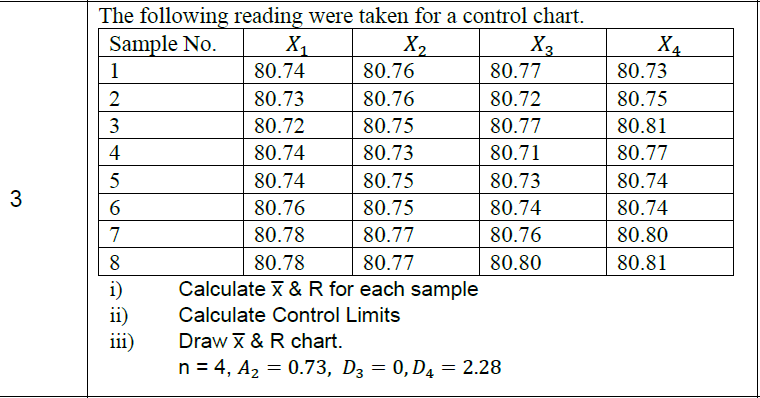
Question: The following reading were taken for a control chart. Sample No. X X2 X2 1 80.74 80.76 80.77 2 80.73 80.76 80.72 3 80.72 80.75

The following reading were taken for a control

The following reading were taken for a control chart. Sample No. X X2 X2 1 80.74 80.76 80.77 2 80.73 80.76 80.72 3 80.72 80.75 80.77 4 80.74 80.73 80.71 5 80.74 80.75 80.73 6 80.76 80.75 80.74 7 80.78 80.77 80.76 8 80.78 80.77 80.80 i) Calculate & R for each sample 11) Calculate Control Limits iii) Draw X & R chart. n = 4, A2 = 0.73, D3 = 0,D4 = 2.28 X4 80.73 80.75 80.81 80.77 80.74 80.74 80.80 80.81 3

Step by Step Solution

There are 3 Steps involved in it

1 Expert Approved Answer
Step: 1 Unlock blur-text-image
Question Has Been Solved by an Expert!

Get step-by-step solutions from verified subject matter experts

Step: 2 Unlock
Step: 3 Unlock

Students Have Also Explored These Related General Management Questions!