

Question: The following scatterplot displays the linear association between two variables, Hunger (percent of the population considered undernourished)and Life Expectancy (average life expectancyin years), for 217
The following scatterplot displays the linear association betweentwo variables, Hunger(percent of the population considered undernourished)and Life Expectancy (average life expectancyin years), for 217 countries in 2018 or most recently available year. (Source: Dataset "AllCountries" in R package "Lock5Data": Datasets for the third edition of "Statistics: Unlocking the Power of Data" by Lock^5).
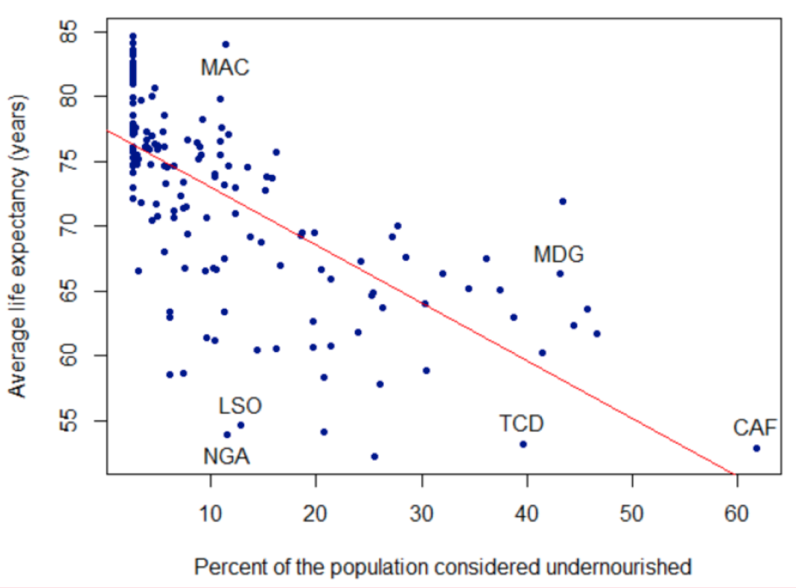
MAC 2 Average life expectancy (years) MDG 60 LSO TCD CAF NGA 10 20 30 40 50 60 Percent of the population considered undernourished
Step by Step Solution
There are 3 Steps involved in it
1 Expert Approved Answer
Step: 1 Unlock

Question Has Been Solved by an Expert!
Get step-by-step solutions from verified subject matter experts
Step: 2 Unlock
Step: 3 Unlock