

Question: The following scatterplot presents the relationship between average ticket price (the average price paid per attendee) in dollars and the gross revenue (in millions of
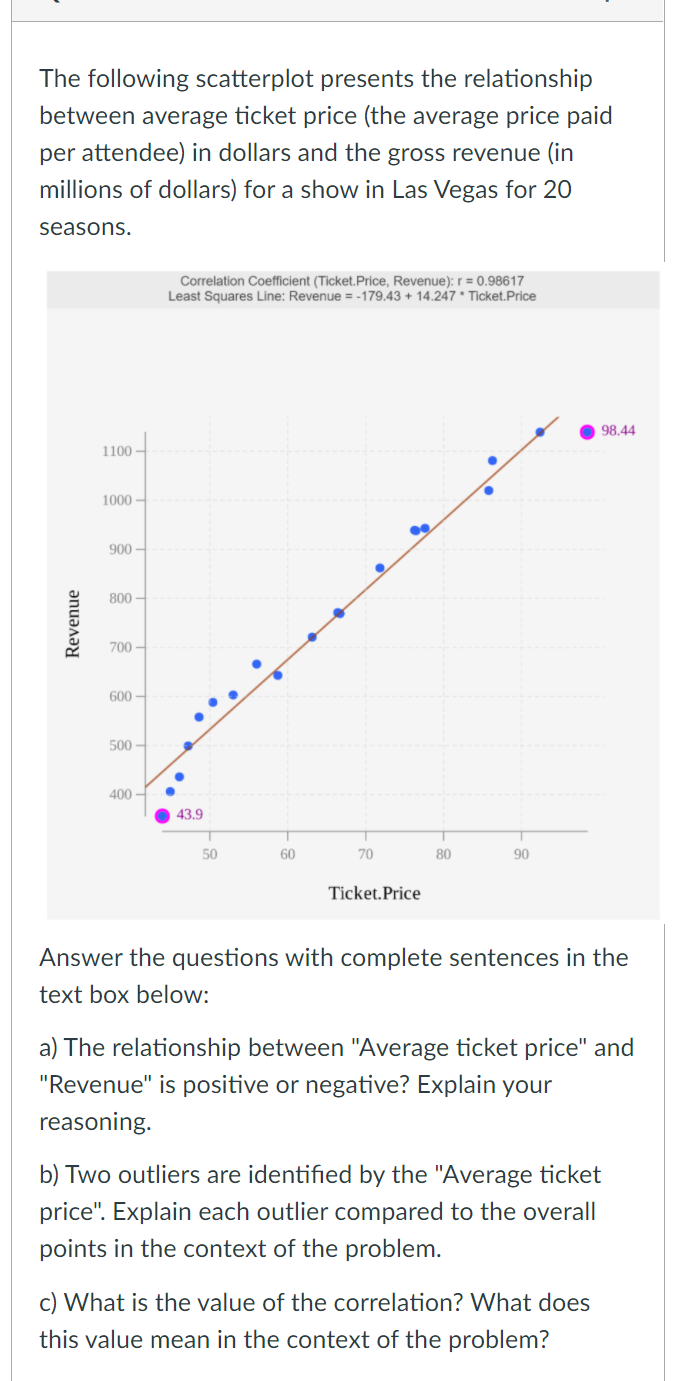
The following scatterplot presents the relationship between average ticket price (the average price paid per attendee) in dollars and the gross revenue (in millions of dollars) for a show in Las Vegas for 20 seasons. Correlation Coefficient (Ticket.Price, Revenue): r = 0.98617 Least Squares Line: Revenue = -179.43 + 14.247 * Ticket.Price 98.44 1100 - 1000 - 900 800 Revenue 700 600 - 500 - 400 43.9 50 60 70 80 90 Ticket.Price Answer the questions with complete sentences in the text box below: a) The relationship between "Average ticket price" and "Revenue" is positive or negative? Explain your reasoning. b) Two outliers are identified by the "Average ticket price". Explain each outlier compared to the overall points in the context of the problem. c) What is the value of the correlation? What does this value mean in the context of the
Step by Step Solution
There are 3 Steps involved in it

Get step-by-step solutions from verified subject matter experts