

Question: The following scatterplot shows the flight period in days (y) and the wingspan in mm (@) for 23 butterflies in Finland. Wingspan A data analysis
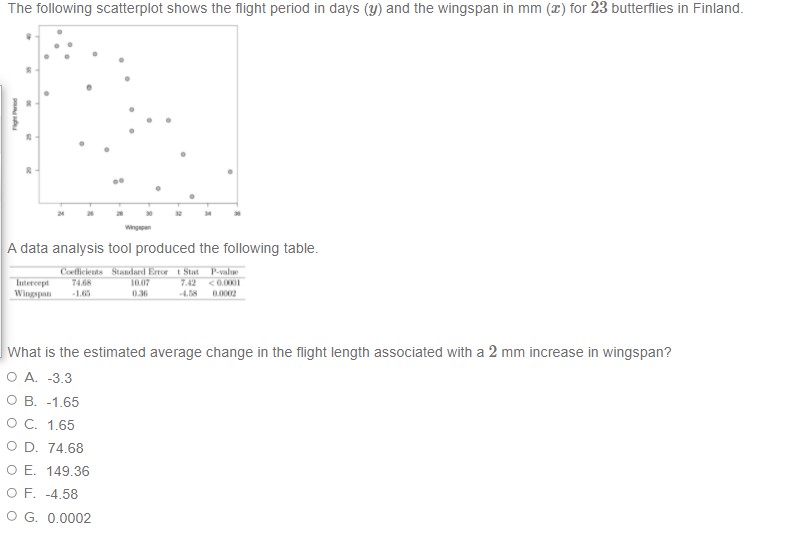
The following scatterplot shows the flight period in days (y) and the wingspan in mm (@) for 23 butterflies in Finland. Wingspan A data analysis tool produced the following table. Coefficients Standard Error : Sint P-value Intercept 10407 7.42 Wingspan -1.65 What is the estimated average change in the flight length associated with a 2 mm increase in wingspan? O A. -3.3 O B. -1.65 O C. 1.65 O D. 74.68 O E. 149.36 OF. -4.58 O G. 0.0002
Step by Step Solution
There are 3 Steps involved in it
1 Expert Approved Answer
Step: 1 Unlock

Question Has Been Solved by an Expert!
Get step-by-step solutions from verified subject matter experts
Step: 2 Unlock
Step: 3 Unlock