

Question: The following scatterplot shows the flight period in days (y) and the wingspan in mm () for 23 butterflies in Finland. Wingspan How does a
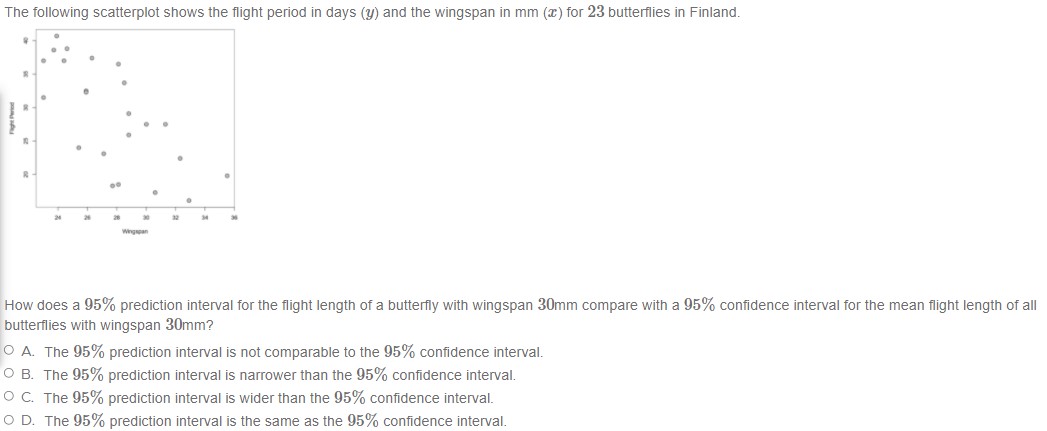
The following scatterplot shows the flight period in days (y) and the wingspan in mm () for 23 butterflies in Finland. Wingspan How does a 95% prediction interval for the flight length of a butterfly with wingspan 30mm compare with a 95% confidence interval for the mean flight length of all butterflies with wingspan 30mm? O A. The 95% prediction interval is not comparable to the 95% confidence interval. O B. The 95% prediction interval is narrower than the 95% confidence interval. O C. The 95% prediction interval is wider than the 95% confidence interval. O D. The 95% prediction interval is the same as the 95% confidence interval
Step by Step Solution
There are 3 Steps involved in it
1 Expert Approved Answer
Step: 1 Unlock

Question Has Been Solved by an Expert!
Get step-by-step solutions from verified subject matter experts
Step: 2 Unlock
Step: 3 Unlock