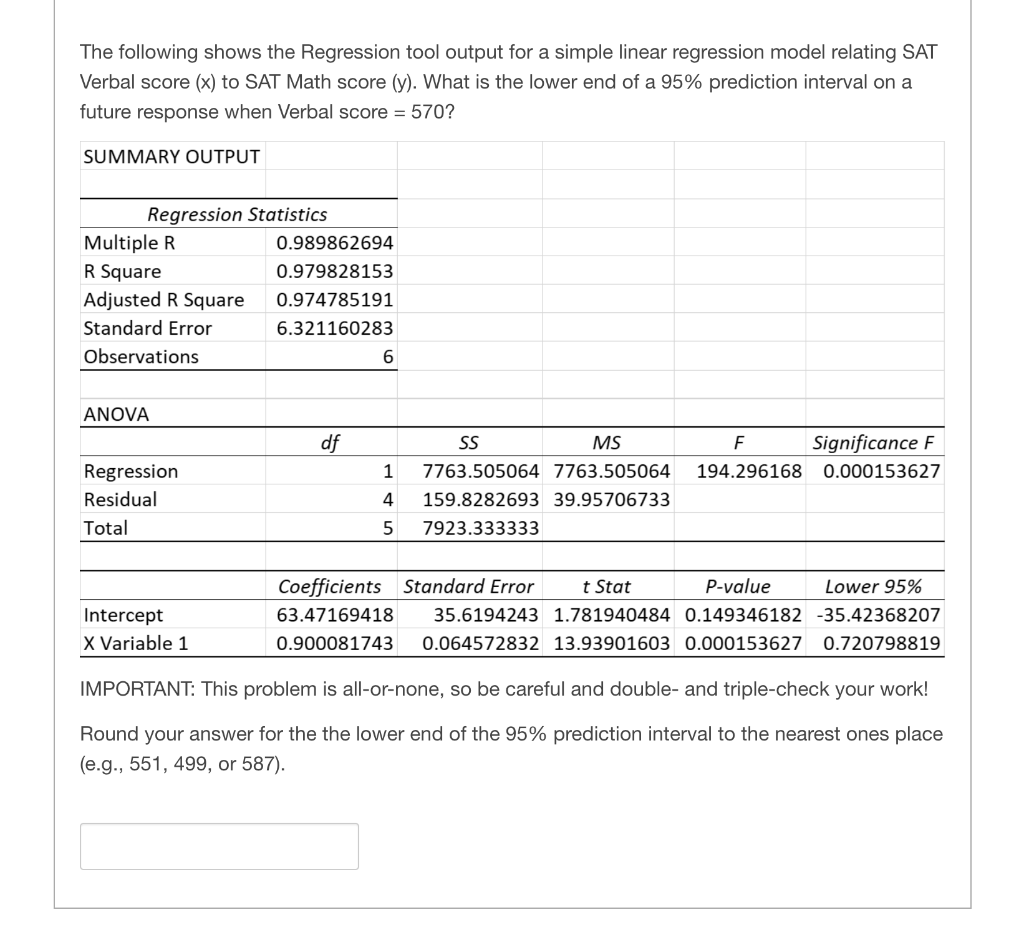
Question: The following shows the Regression tool output for a simple linear regression model relating SAT Verbal score (x) to SAT Math score (y). What is

The following shows the Regression tool output

The following shows the Regression tool output for a simple linear regression model relating SAT Verbal score (x) to SAT Math score (y). What is the lower end of a 95% prediction interval on a future response when Verbal score = 570? SUMMARY OUTPUT Regression Statistics Multiple R 0.989862694 R Square 0.979828153 Adjusted R Square 0.974785191 Standard Error 6.321160283 Observations 6 ANOVA df F Significance F 194.296168 0.000153627 1 Regression Residual Total SS MS 7763.505064 7763.505064 159.8282693 39.95706733 7923.333333 4 5 Intercept X Variable 1 Coefficients Standard Error t Stat P-value Lower 95% 63.47169418 35.6194243 1.781940484 0.149346182 -35.42368207 0.900081743 0.064572832 13.93901603 0.000153627 0.720798819 IMPORTANT: This problem is all-or-none, so be careful and double- and triple-check your work! Round your answer for the the lower end of the 95% prediction interval to the nearest ones place (e.g., 551, 499, or 587)

Step by Step Solution

There are 3 Steps involved in it

1 Expert Approved Answer
Step: 1 Unlock blur-text-image
Question Has Been Solved by an Expert!

Get step-by-step solutions from verified subject matter experts

Step: 2 Unlock
Step: 3 Unlock

Students Have Also Explored These Related General Management Questions!