

Question: The following stem-and-leaf plot represents the distribution of weights for a group of people. Stem Leaves 12 0 3 4 6 7 13 1 3

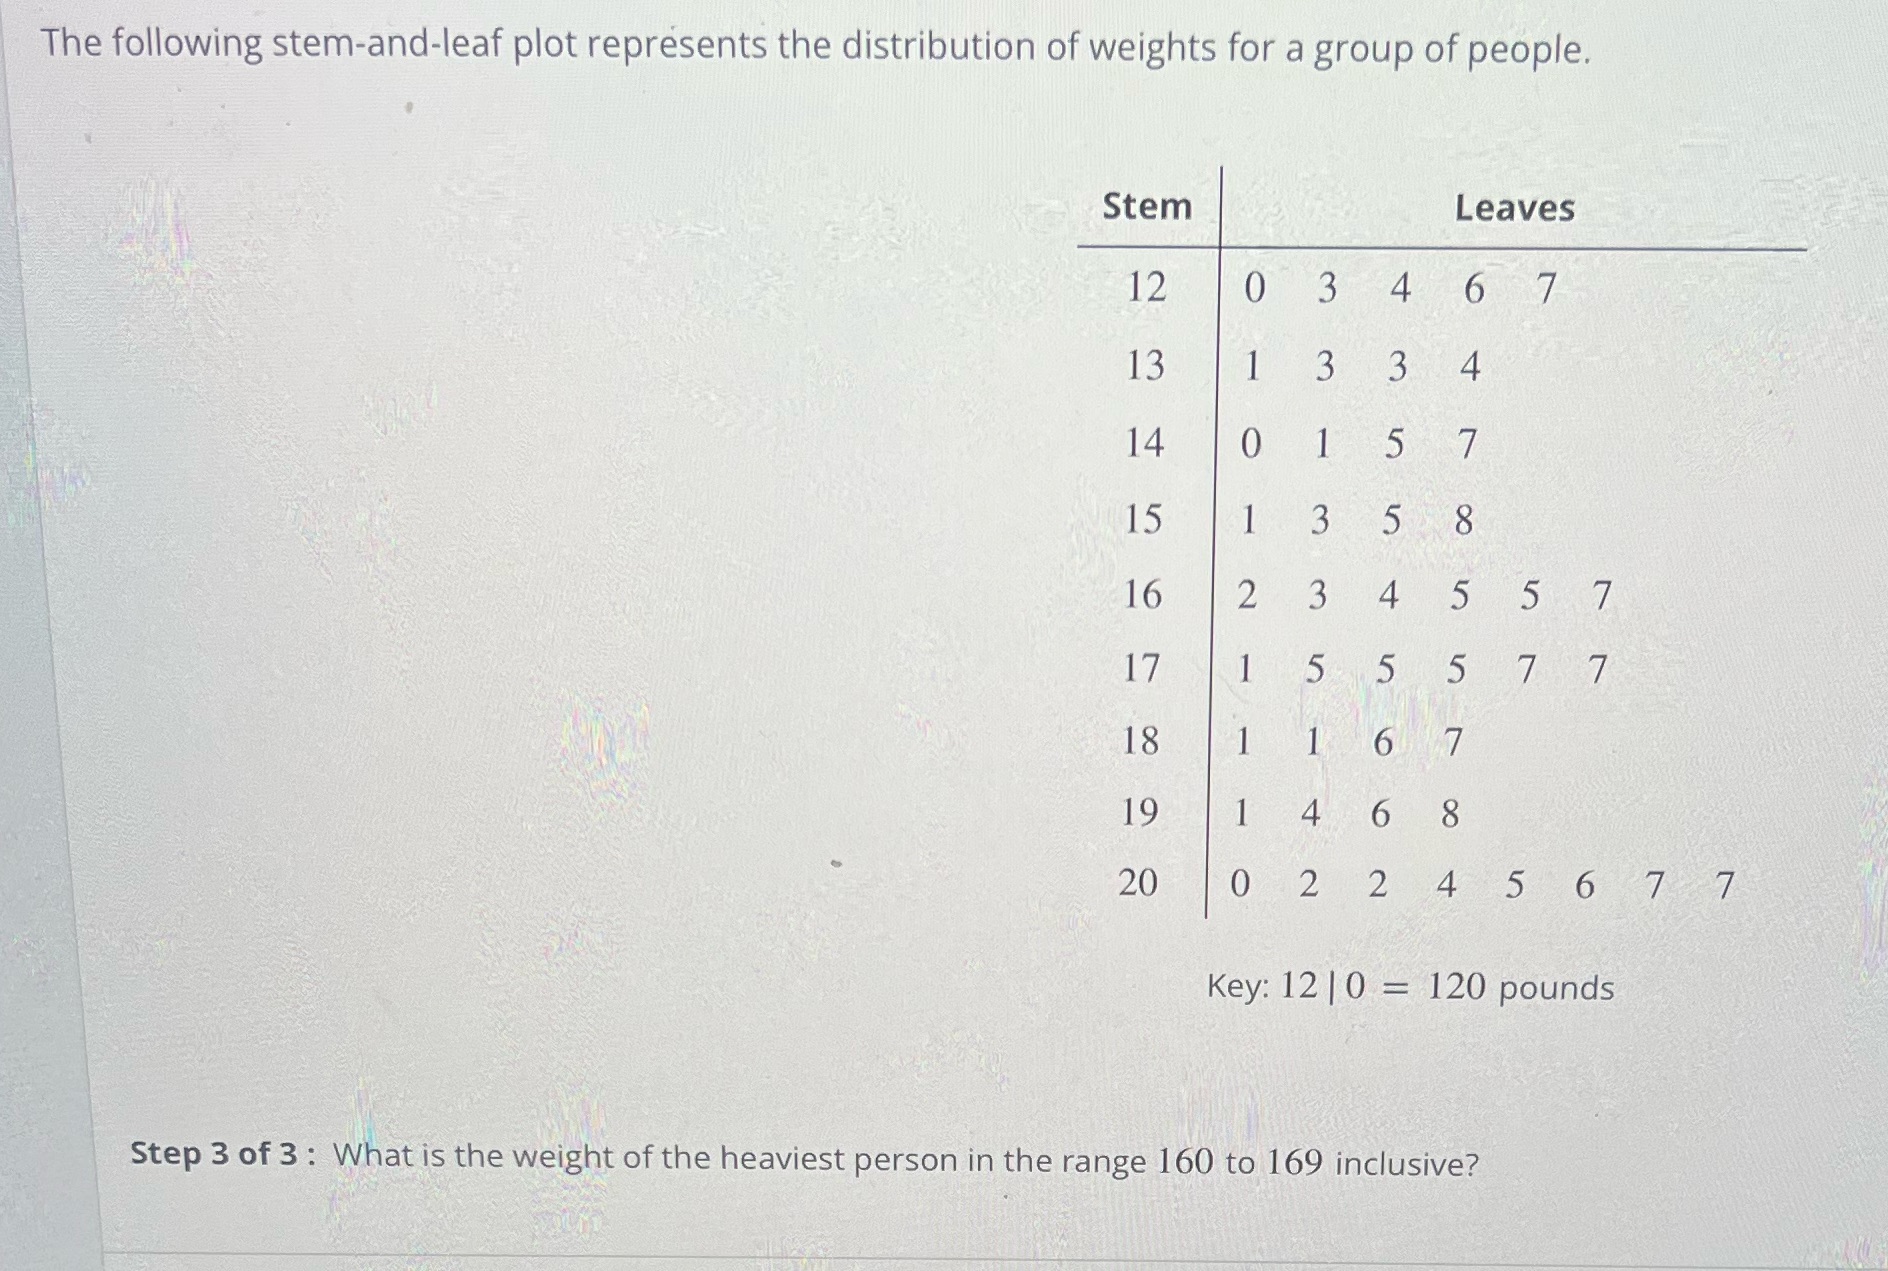
The following stem-and-leaf plot represents the distribution of weights for a group of people. Stem Leaves 12 0 3 4 6 7 13 1 3 3 4 14 0 1 5 7 15 1 3 5 8 16 2 3 4 5 5 7 17 1 5 5 5 7 7 18 1 1 6 7 19 1 4 6 8 20 0 2 2 4 5 6 7 7 Key: 12 | 0 = 120 pounds Step 3 of 3 : What is the weight of the heaviest person in the range 160 to 169 inclusive
Step by Step Solution
There are 3 Steps involved in it
1 Expert Approved Answer
Step: 1 Unlock

Question Has Been Solved by an Expert!
Get step-by-step solutions from verified subject matter experts
Step: 2 Unlock
Step: 3 Unlock