

Question: The following table gives data on monthly changes in the spot price and the futures price for a certain commodity. AS LAF +0.50 | +0.56
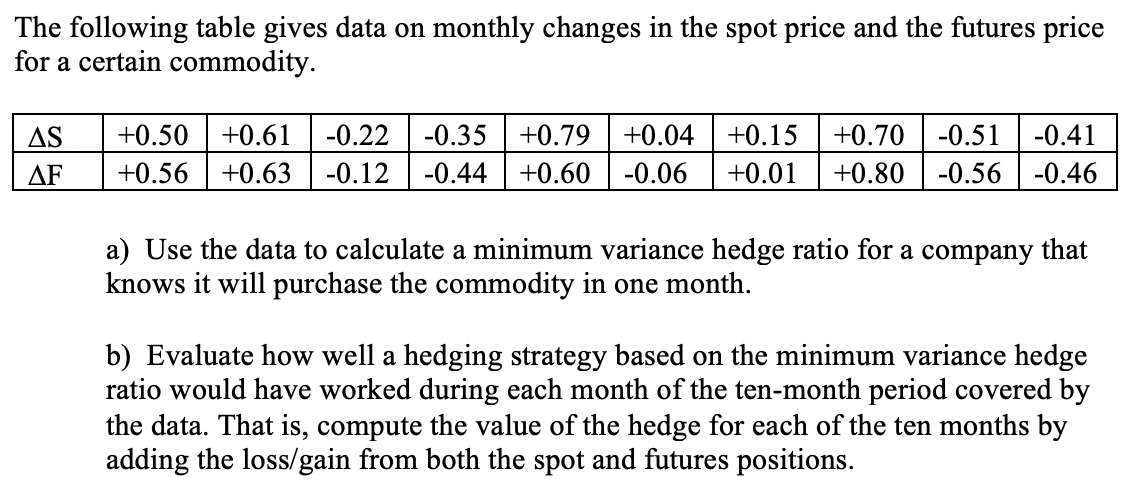
The following table gives data on monthly changes in the spot price and the futures price for a certain commodity. AS LAF +0.50 | +0.56 +0.61 +0.63 -0.22 -0.12 -0.35 -0.44 +0.79 +0.60 +0.04 -0.06 +0.15 +0.01 +0.70 +0.80 -0.51 -0.41 -0.56 -0.46 a) Use the data to calculate a minimum variance hedge ratio for a company that knows it will purchase the commodity in one month. b) Evaluate how well a hedging strategy based on the minimum variance hedge ratio would have worked during each month of the ten-month period covered by the data. That is, compute the value of the hedge for each of the ten months by adding the loss/gain from both the spot and futures positions
Step by Step Solution
There are 3 Steps involved in it

Get step-by-step solutions from verified subject matter experts