

Question: The following table gives data on monthly changes in the spot price and the futures price for a certain commodity. Use the data to calculate
The following table gives data on monthly changes in the spot price and the futures price for a certain commodity. Use the data to calculate the optimal hedge ratio.
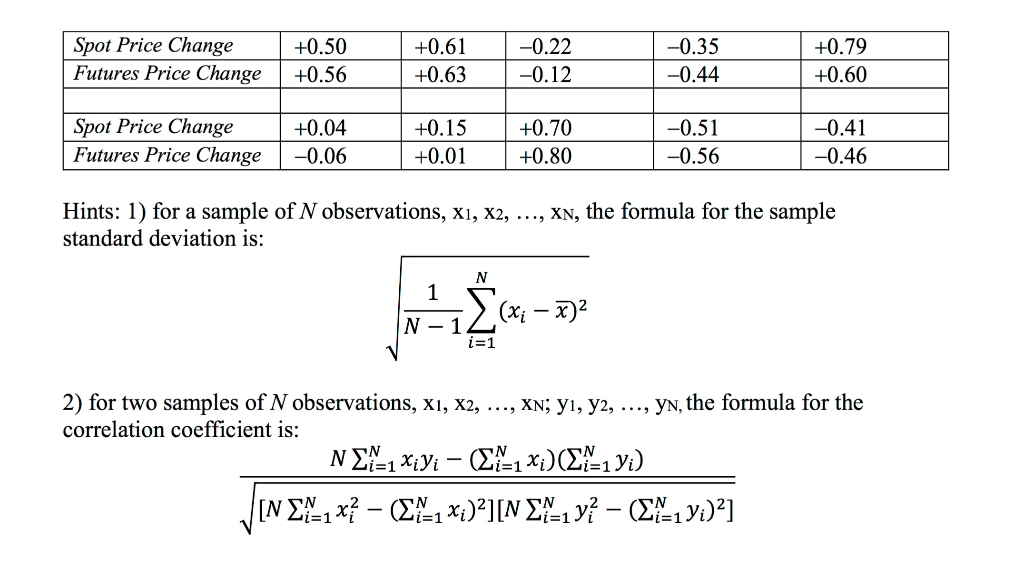
Spot Price Change Futures Price Change +0.50 +0.56 +0.61 +0.63 -0.22 -0.12 -0.35 -0.44 +0.79 +0.60 Spot Price Change Futures Price Change +0.04 -0.06 +0.15 +0.01 +0.70 +0.80 -0.51 -0.56 -0.41 -0.46 Hints: 1) for a sample of N observations, X1, X2, ..., XN, the formula for the sample standard deviation is: 2) for two samples of N observations, X1, X2, ..., XN; y, y2, ..., yn, the formula for the correlation coefficient is: NX-1 Xiyi (-1 x)(X-1 yi) JIN EE-7 x} - ($^-1 x)?][N {%-18} - (EX-1 Y:)?] Spot Price Change Futures Price Change +0.50 +0.56 +0.61 +0.63 -0.22 -0.12 -0.35 -0.44 +0.79 +0.60 Spot Price Change Futures Price Change +0.04 -0.06 +0.15 +0.01 +0.70 +0.80 -0.51 -0.56 -0.41 -0.46 Hints: 1) for a sample of N observations, X1, X2, ..., XN, the formula for the sample standard deviation is: 2) for two samples of N observations, X1, X2, ..., XN; y, y2, ..., yn, the formula for the correlation coefficient is: NX-1 Xiyi (-1 x)(X-1 yi) JIN EE-7 x} - ($^-1 x)?][N {%-18} - (EX-1 Y:)?]
Step by Step Solution
There are 3 Steps involved in it

Get step-by-step solutions from verified subject matter experts