

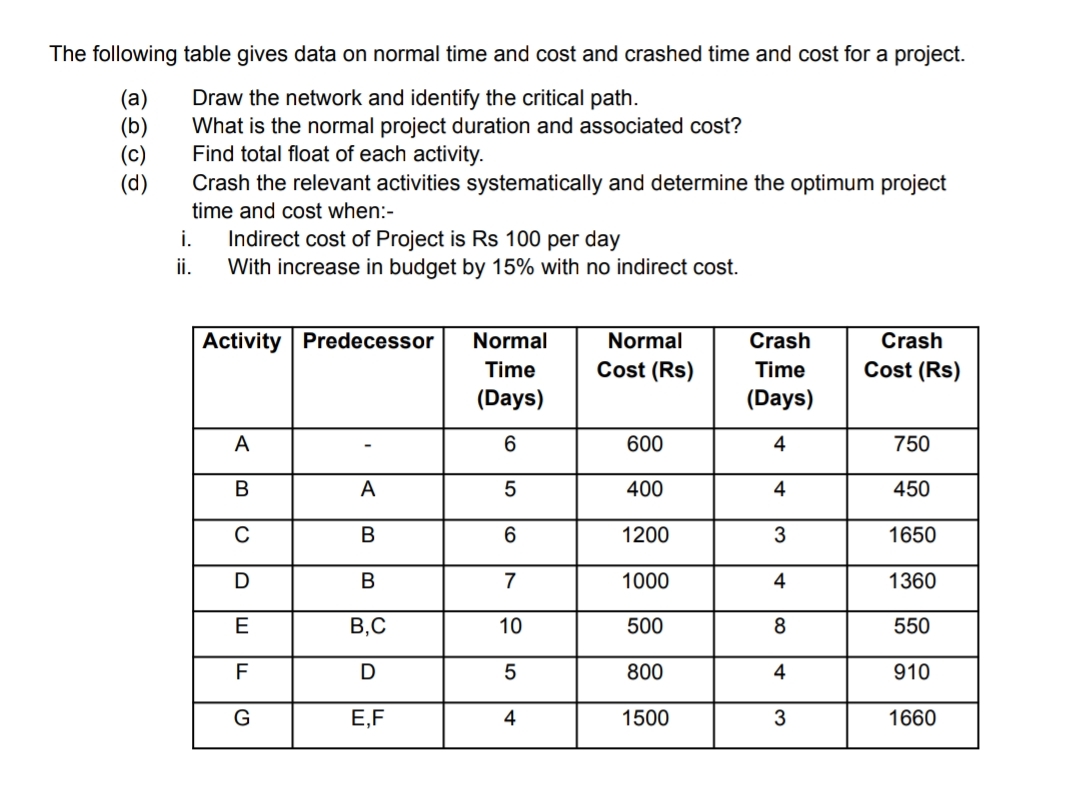
Question: The following table gives data on normal time and cost and crashed time and cost for a project. ( a ) Draw the network and
The following table gives data on normal time and cost and crashed time and cost for a project.
a Draw the network and identify the critical path.
b What is the normal project duration and associated cost?
c Find total float of each activity.
d Crash the relevant activities systematically and determine the optimum project time and cost when:
i Indirect cost of Project is Rs per day
ii With increase in budget by with no indirect cost.
tableActivityPredecessor,tableNormalTimeDaystableNormalCost RstableCrashTimeDaystableCrashCost RsABACBDBEBCFDGEF
Step by Step Solution
There are 3 Steps involved in it
1 Expert Approved Answer
Step: 1 Unlock

Question Has Been Solved by an Expert!
Get step-by-step solutions from verified subject matter experts
Step: 2 Unlock
Step: 3 Unlock