

Question: ?? The following table gives the data for the average temperature and the snow accumulation in several small towns for a single month. Determine the
??
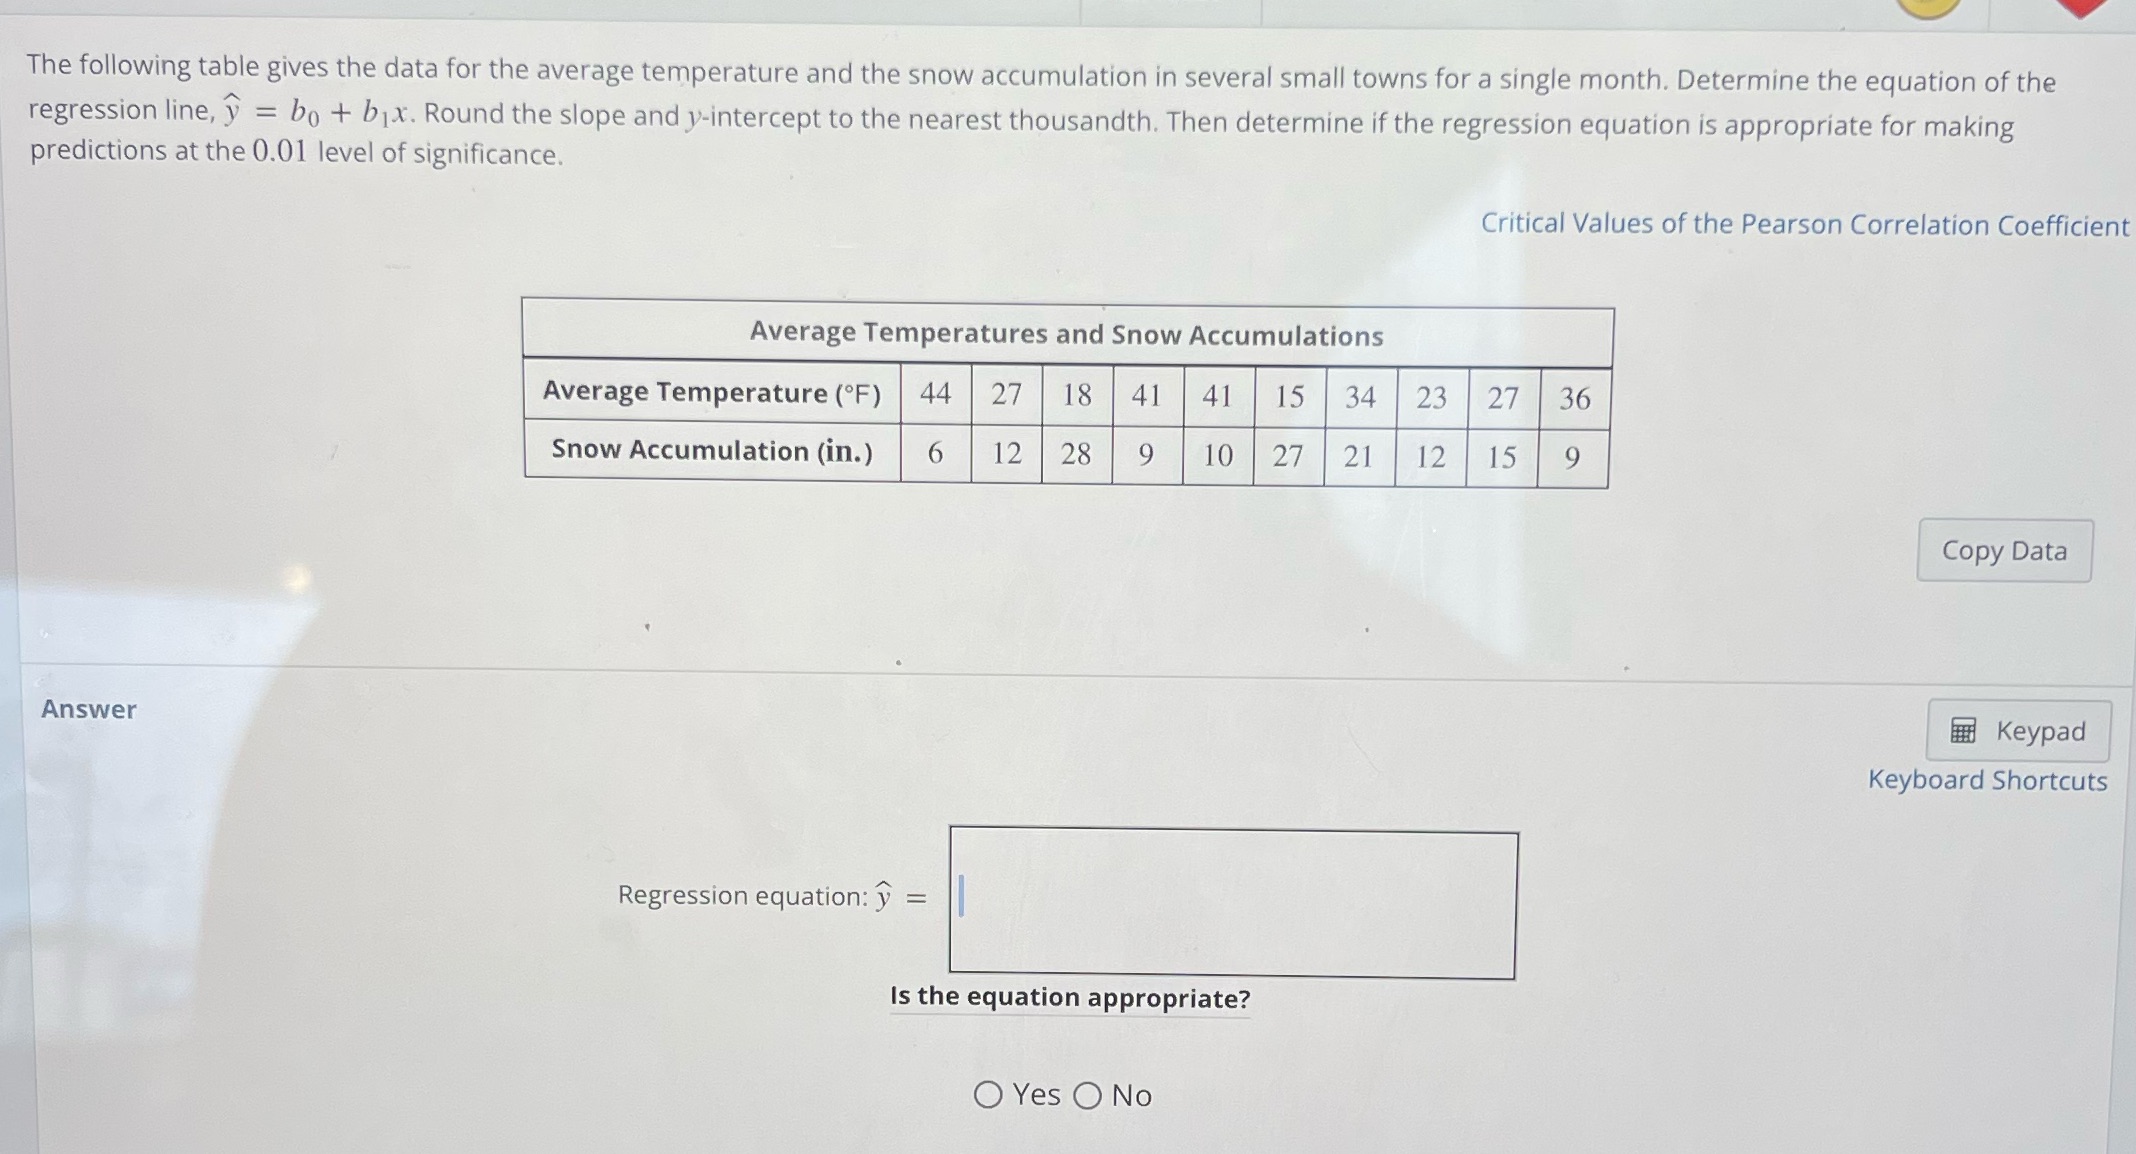
The following table gives the data for the average temperature and the snow accumulation in several small towns for a single month. Determine the equation of the regression line, y = bo + bix. Round the slope and y-intercept to the nearest thousandth. Then determine if the regression equation is appropriate for making predictions at the 0.01 level of significance. Critical Values of the Pearson Correlation Coefficient Average Temperatures and Snow Accumulations Average Temperature (OF) 44 27 18 41 41 15 34 23 27 36 Snow Accumulation (in.) 6 12 28 9 10 27 21 12 15 9 Copy Data Answer Keypad Keyboard Shortcuts Regression equation: y = Is the equation appropriate? O Yes O No
Step by Step Solution
There are 3 Steps involved in it

Get step-by-step solutions from verified subject matter experts