

Question: The following table has Olympic Games Host information; it includes the type and location data for Olympic Games from 1896 to 2024. (The middle years
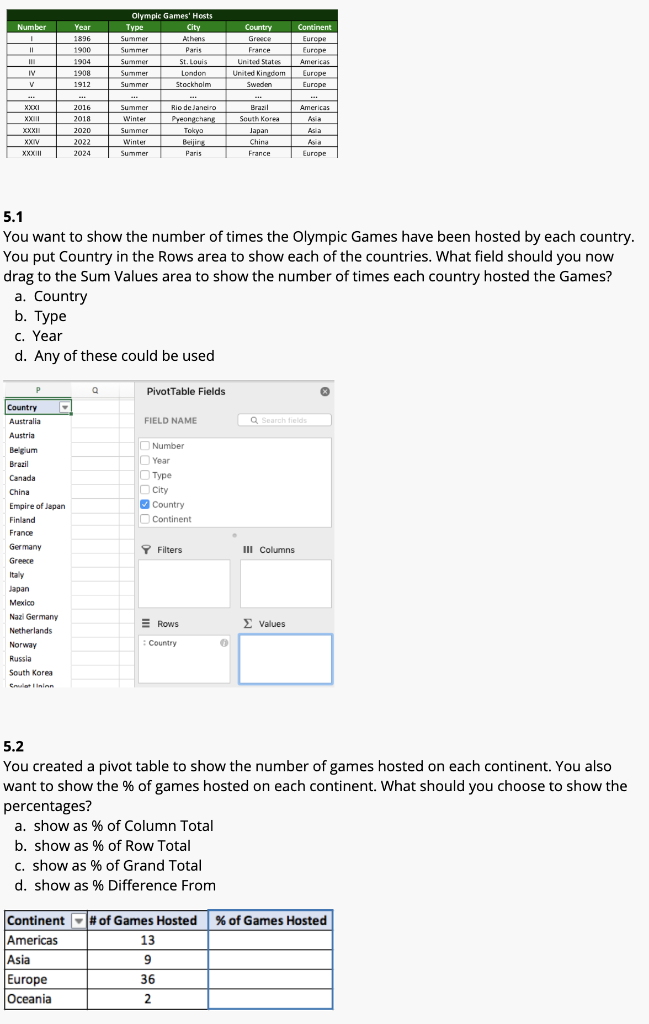
The following table has Olympic Games Host information; it includes the type and location data for Olympic Games from 1896 to 2024. (The middle years have been removed in the image below for space-saving reasons, but assume all the data is included in the analysis.)
5.1 You want to show the number of times the Olympic Games have been hosted by each country. You put Country in the Rows area to show each of the countries. What field should you now drag to the Sum Values area to show the number of times each country hosted the Games? a. Country b. Type c. Year d. Any of these could be used
5.2 You created a pivot table to show the number of games hosted on each continent. You also want to show the % of games hosted on each continent. What should you choose to show the percentages? a. show as % of Column Total b. show as % of Row Total c. show as % of Grand Total d. show as % Difference From
Step by Step Solution
There are 3 Steps involved in it

Get step-by-step solutions from verified subject matter experts