

Question: The following table lists hypothetical values. (1) (2) (3) (4) (5) (6) (7) (8) GDP Deflator Real GDP Percentage GDP Deflator Real GDP Percentage Nominal
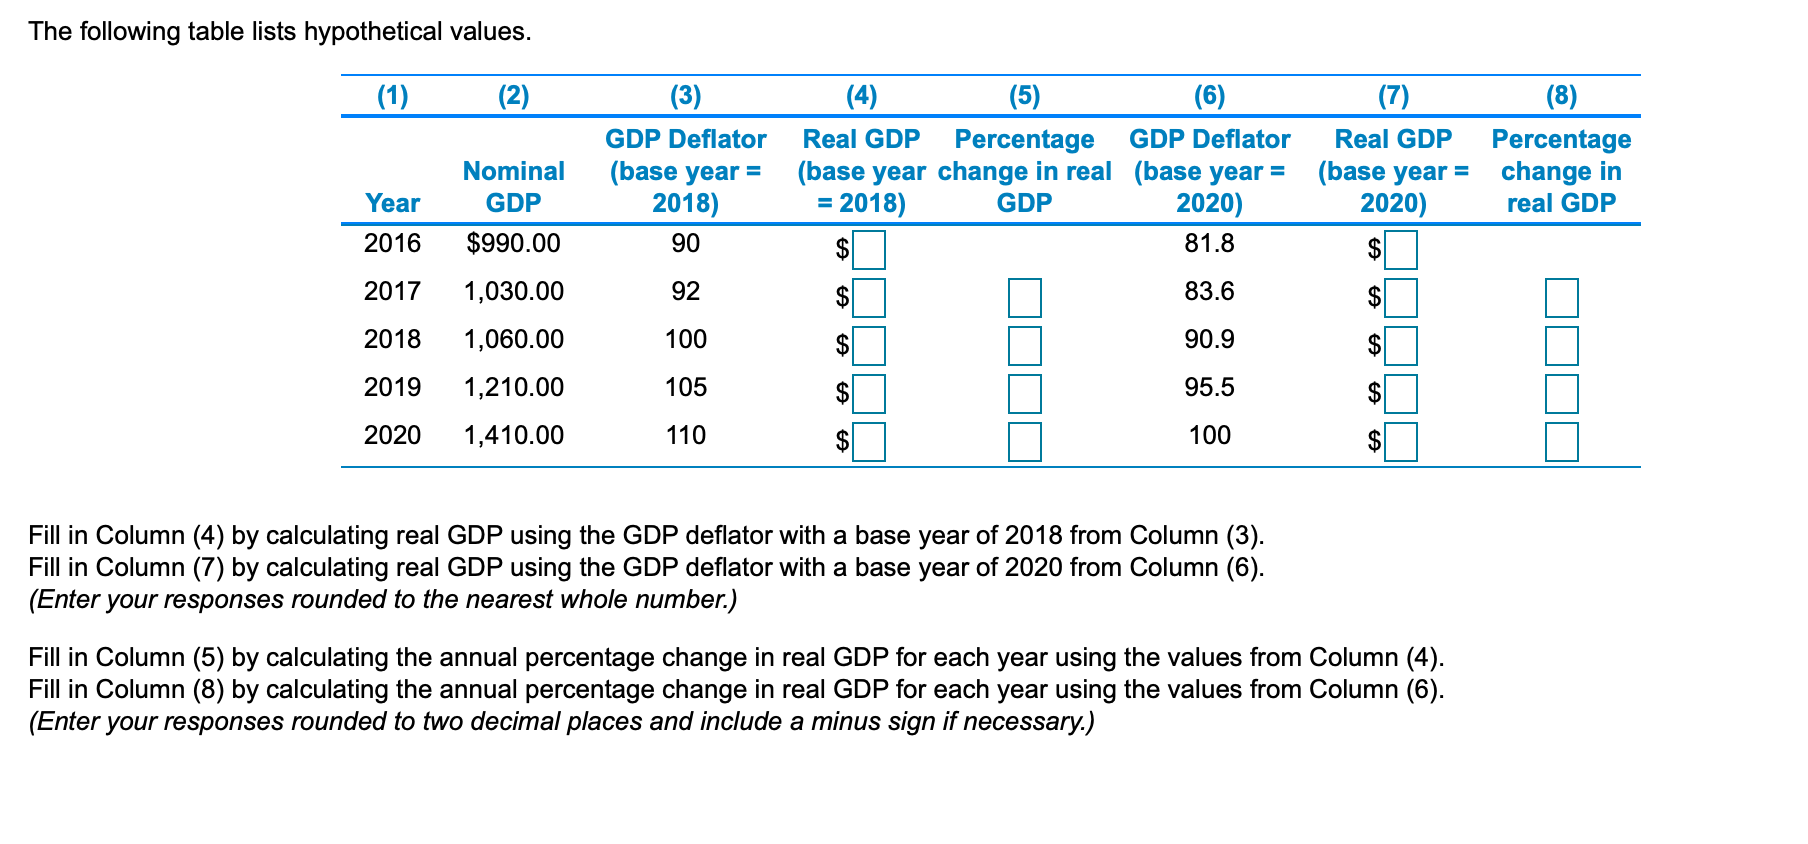

The following table lists hypothetical values. (1) (2) (3) (4) (5) (6) (7) (8) GDP Deflator Real GDP Percentage GDP Deflator Real GDP Percentage Nominal (base year = (base year change in real (base year = (base year = change in Year GDP 2018) = 2018) GDP 2020) 2020) real GDP 2016 $990.00 90 EA 81.8 EA 2017 1,030.00 92 83.6 2018 1,060.00 100 90.9 2019 1,210.00 105 95.5 2020 1,410.00 110 100 EA Fill in Column (4) by calculating real GDP using the GDP deflator with a base year of 2018 from Column (3). Fill in Column (7) by calculating real GDP using the GDP deflator with a base year of 2020 from Column (6). (Enter your responses rounded to the nearest whole number.) Fill in Column (5) by calculating the annual percentage change in real GDP for each year using the values from Column (4). Fill in Column (8) by calculating the annual percentage change in real GDP for each year using the values from Column (6). (Enter your responses rounded to two decimal places and include a minus sign if necessary.)
Step by Step Solution
There are 3 Steps involved in it

Get step-by-step solutions from verified subject matter experts