

Question: The following table lists hypothetical values. (1) (2) (3) (4) (5) (6) (7) (8) GDP Deflator Real GDP Percentage GDP Deflator Real GDP Percentage Nominal
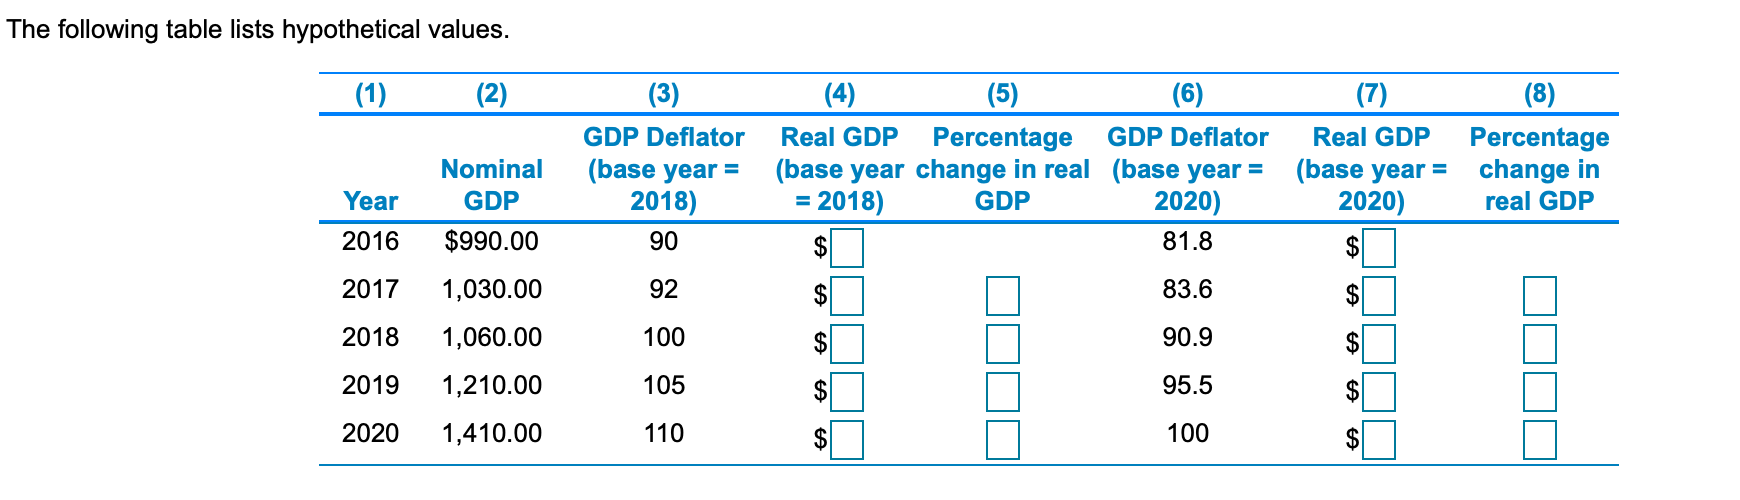
The following table lists hypothetical values. (1) (2) (3) (4) (5) (6) (7) (8) GDP Deflator Real GDP Percentage GDP Deflator Real GDP Percentage Nominal (base year = (base year change in real (base year = (base year = change in Year GDP 2018) = 2018) GDP 2020) 2020) real GDP 2016 $990.00 90 81.8 EA 2017 1,030.00 92 83.6 2018 1,060.00 100 90.9 2019 1,210.00 105 95.5 2020 1,410.00 110 100
Step by Step Solution
There are 3 Steps involved in it
1 Expert Approved Answer
Step: 1 Unlock

Question Has Been Solved by an Expert!
Get step-by-step solutions from verified subject matter experts
Step: 2 Unlock
Step: 3 Unlock