

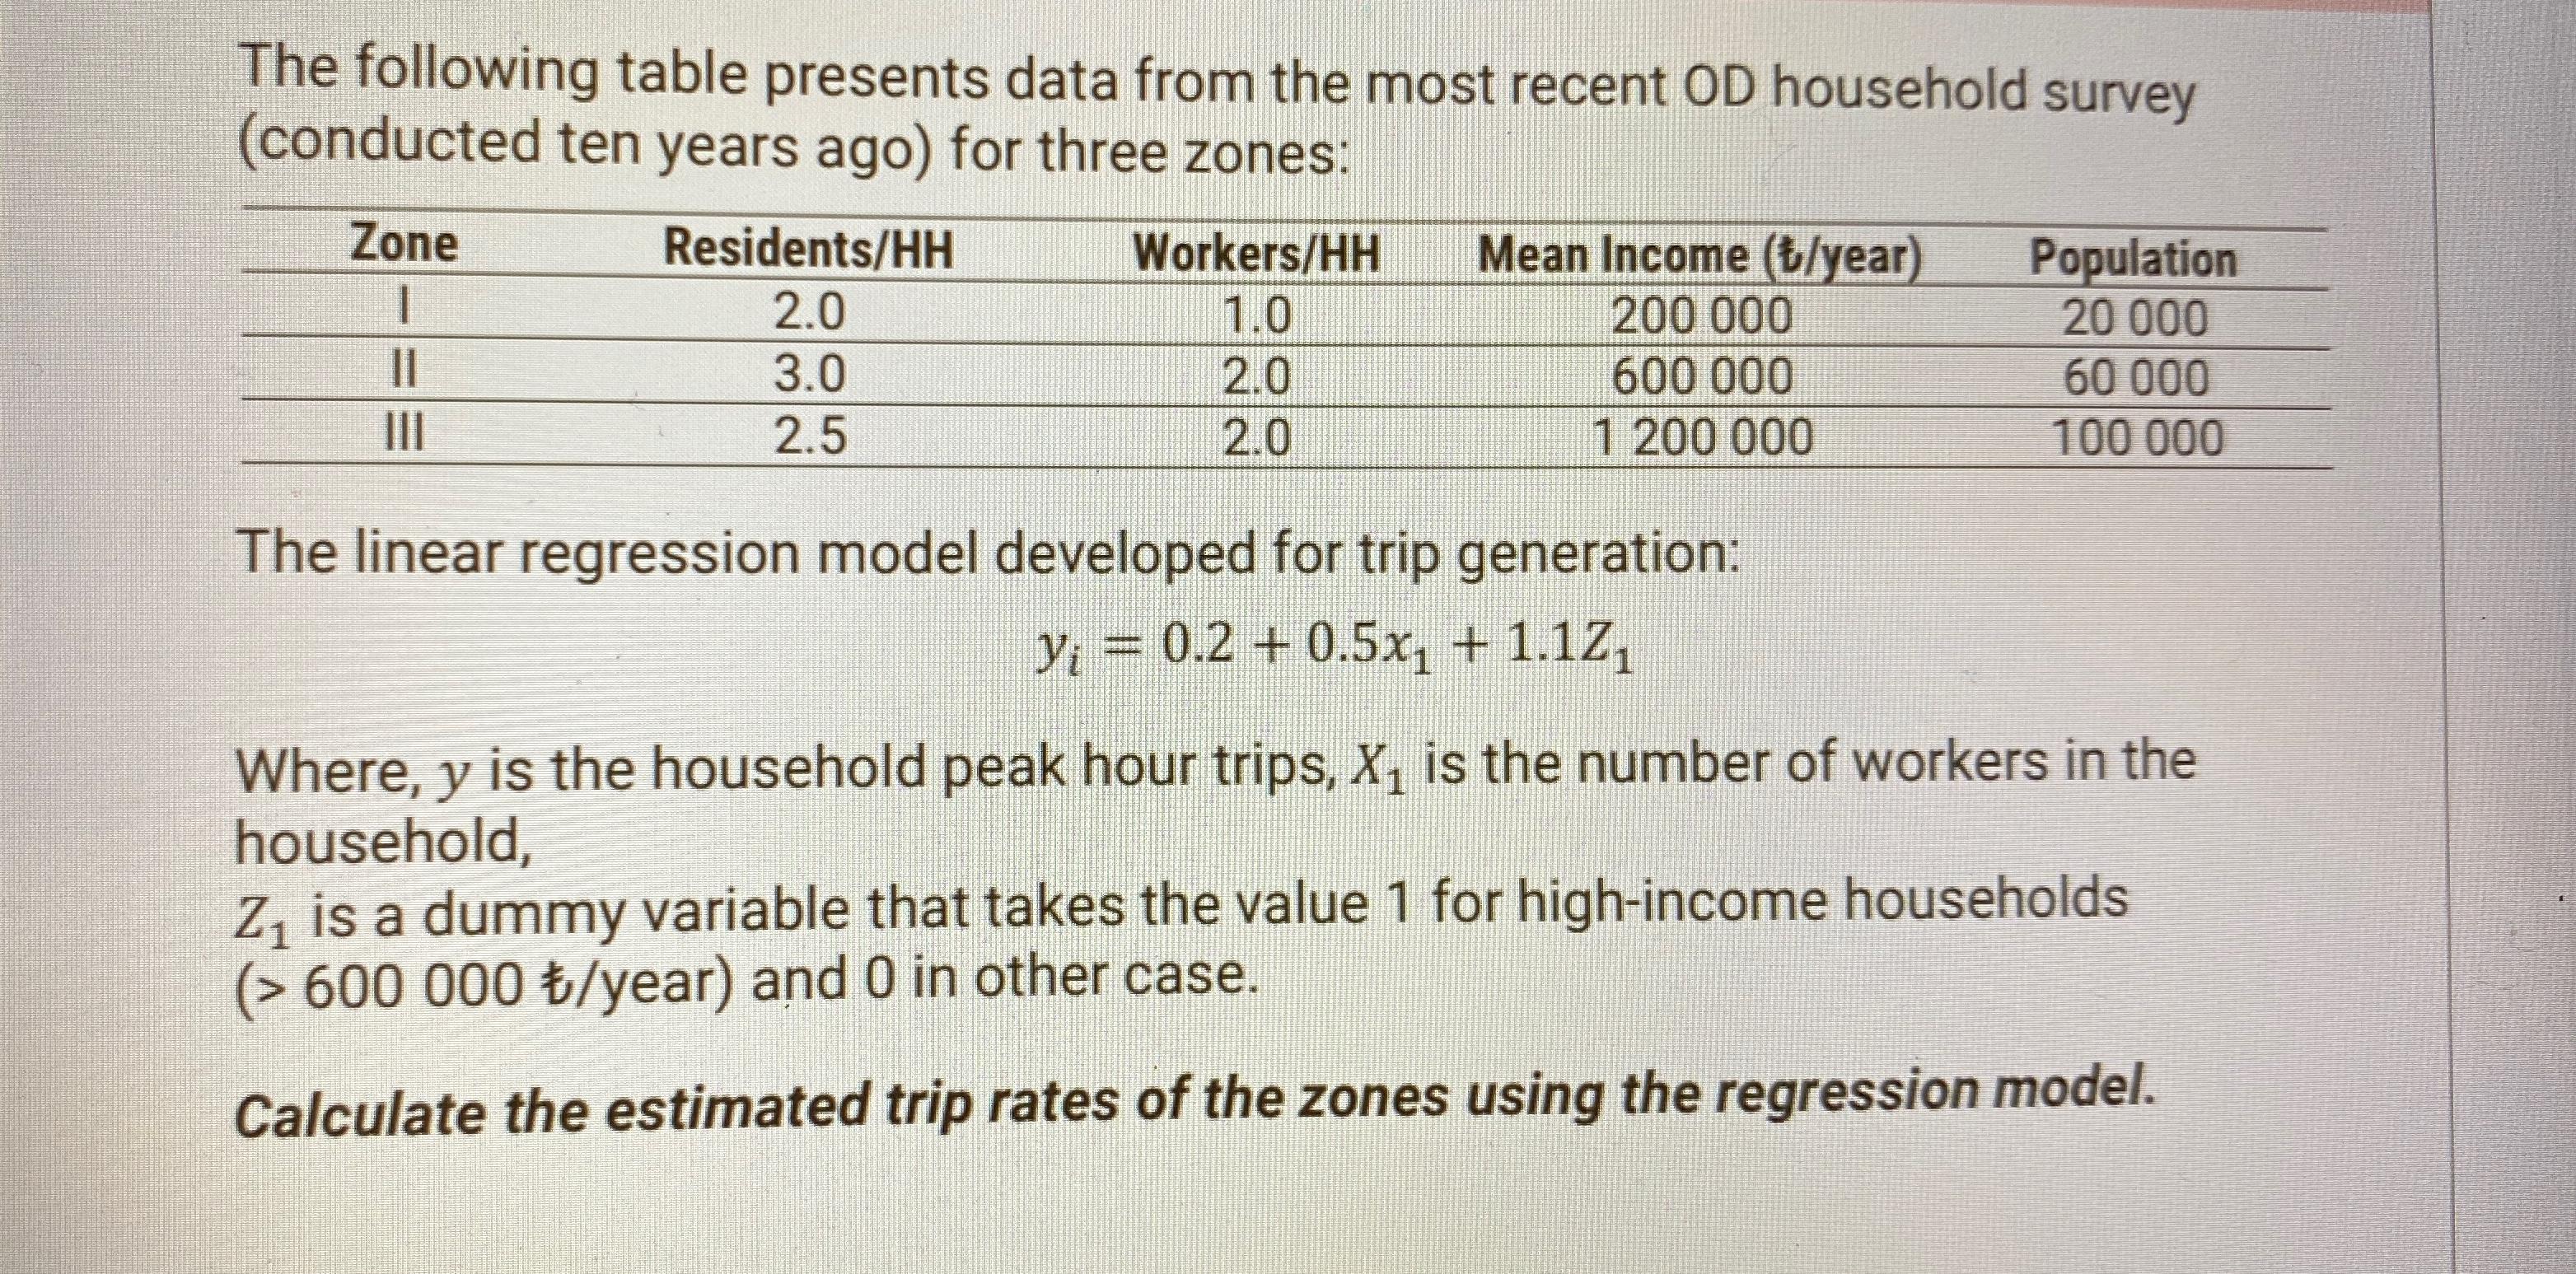
Question: The following table presents data from the most recent OD household survey ( conducted ten years ago ) for three zones: table [ [
The following table presents data from the most recent OD household survey conducted ten years ago for three zones:
tableZoneResidentsHHWorkersHHMean Income tyearPopulationIIIIII
The linear regression model developed for trip generation:
Where, is the household peak hour trips, is the number of workers in the household,
is a dummy variable that takes the value for highincome households year and in other case.
Calculate the estimated trip rates of the zones using the regression model.
Step by Step Solution
There are 3 Steps involved in it
1 Expert Approved Answer
Step: 1 Unlock

Question Has Been Solved by an Expert!
Get step-by-step solutions from verified subject matter experts
Step: 2 Unlock
Step: 3 Unlock