

Question: The following table provides the data for the linear regression model of annual sales for the last ten years. What is the slope (trend)? Question
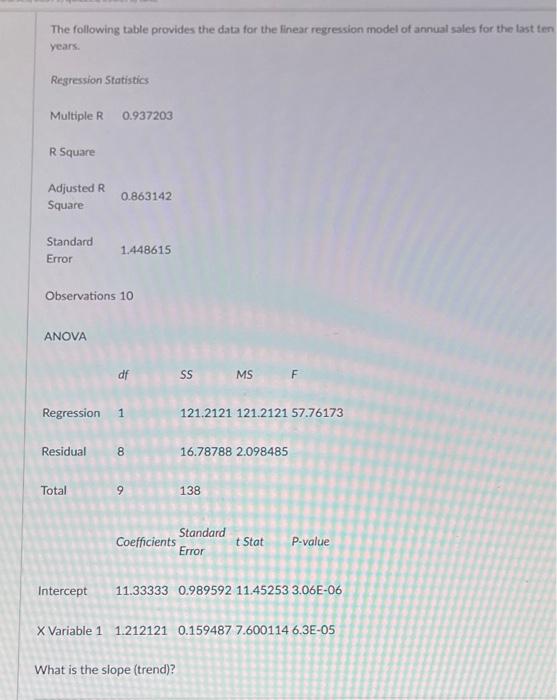
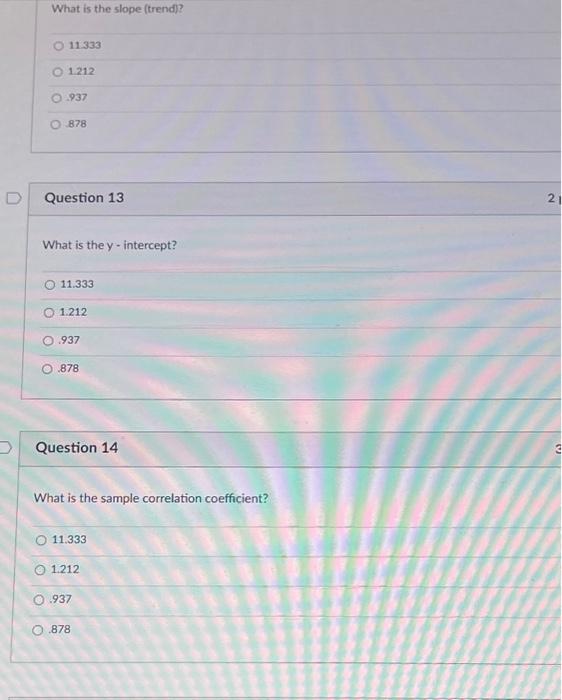
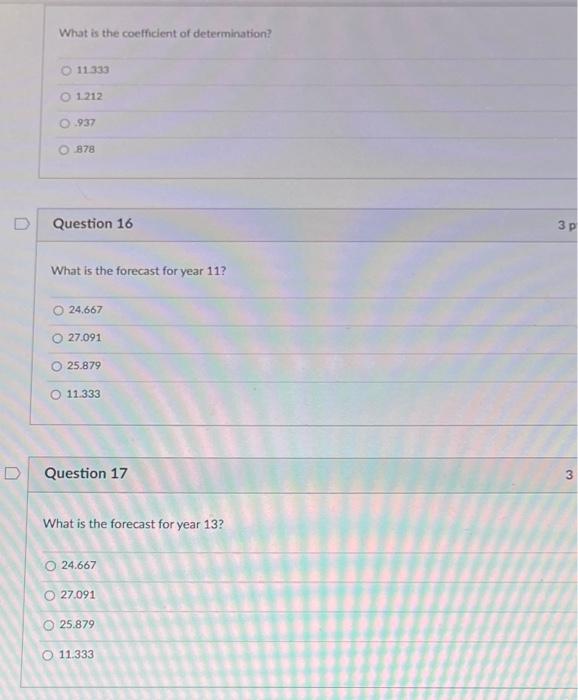
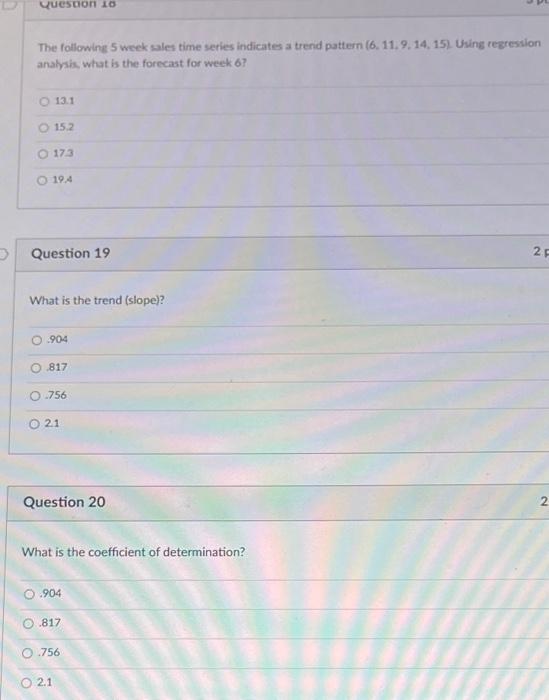
The following table provides the data for the linear regression model of annual sales for the last ten years. What is the slope (trend)? Question 13 What is the y - intercept? \begin{tabular}{|l|} \hline 11.333 \\ \hline 1.212 \\ \hline .937 \\ \hline .878 \\ \hline \end{tabular} Question 14 What is the sample correlation coefficient? 11.3331.212.937 What is the coefficient of determination? 11333 1212 937 878 Question 16 What is the forecast for year 11 ? 24.667 27.091 25.879 11.333 Question 17 What is the forecast for year 13? 24.667 27.091 25.879 The following 5 week sales time series indicates a trend pattern (6,11,9,14,15) Using regression analysis, what is the forecast for week 6 ? 13.1 15.2 17.3 19.4 Question 19 What is the trend (slope)? 904 817 .756 21 Question 20 What is the coefficient of determination? 904 .817 .756 2.1 What is the correlation coefficient? What is the mean absolute percentage error? 1.98 12.48 1.2 2.1 Question 23 What is the forecast for week 10 ? 15.1 17.3 It is not possible to forecast
Step by Step Solution
There are 3 Steps involved in it

Get step-by-step solutions from verified subject matter experts