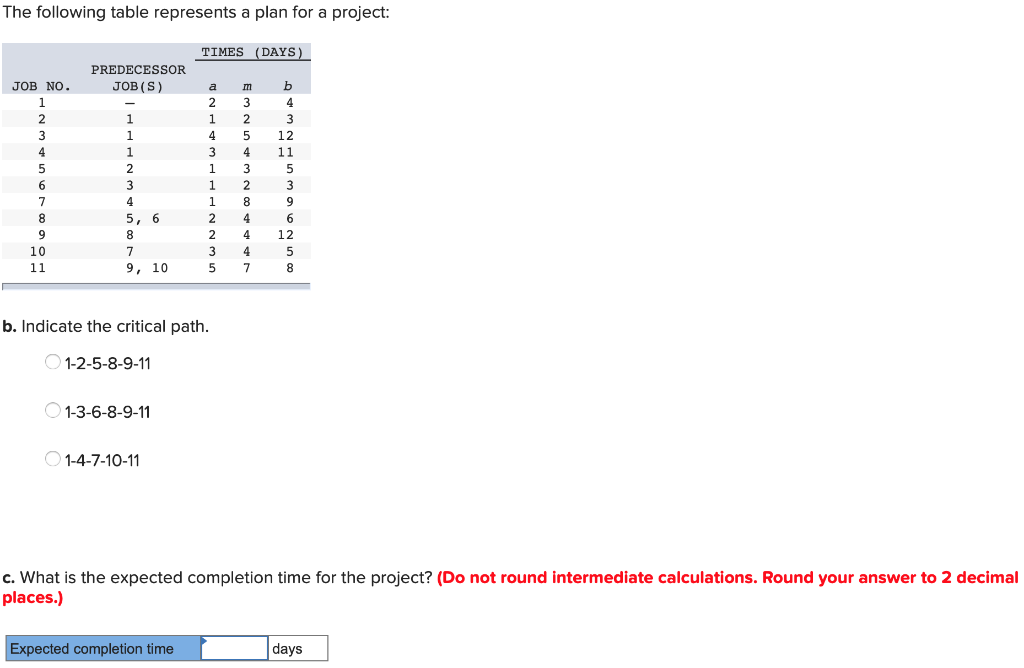
Question: The following table represents a plan for a project: TIMES (DAYS) JOB NO. PREDECESSOR JOB (S) a mb 2 3 4 1 2 5 3

The following table represents a plan for aThe following table represents a plan for aThe following table represents a plan for a

The following table represents a plan for a project: TIMES (DAYS) JOB NO. PREDECESSOR JOB (S) a mb 2 3 4 1 2 5 3 2 OaWN NEW 5, 6 2 2 3 5 4 4 4 7 12 5 8 9, 10 b. Indicate the critical path. 1-2-5-8-9-11 1-3-6-8-9-11 1-4-7-10-11 c. What is the expected completion time for the project? (Do not round intermediate calculations. Round your answer to 2 decimal places.) Expected completion time days d. You can accomplish any one of the following at an additional cost of $1,500. If you will save $1,000 for each day that the earliest completion time is reduced, which of the following actions should be taken, if any? 1. Reduce job 5 by two days. O Yes O No 2. Reduce job 3 by two days. Yes O No 3. Reduce job 7 by two days. o Yes e. What is the probability that the project will take more than 30 days to complete? (Use Excel's NORMSDIST() function to find the correct probability for your computed Z-value. Other than the expected completion time you entered in part c above, do not round intermediate calculations. Round "z" value to 2 decimal places your final answer to 4 decimal places.) Probability

Step by Step Solution

There are 3 Steps involved in it

1 Expert Approved Answer
Step: 1 Unlock blur-text-image
Question Has Been Solved by an Expert!

Get step-by-step solutions from verified subject matter experts

Step: 2 Unlock
Step: 3 Unlock

Students Have Also Explored These Related General Management Questions!