

Question: The following table represents event precedence constraints and expected activity times for a set of activities: Activity A-> B A-> C B -> D
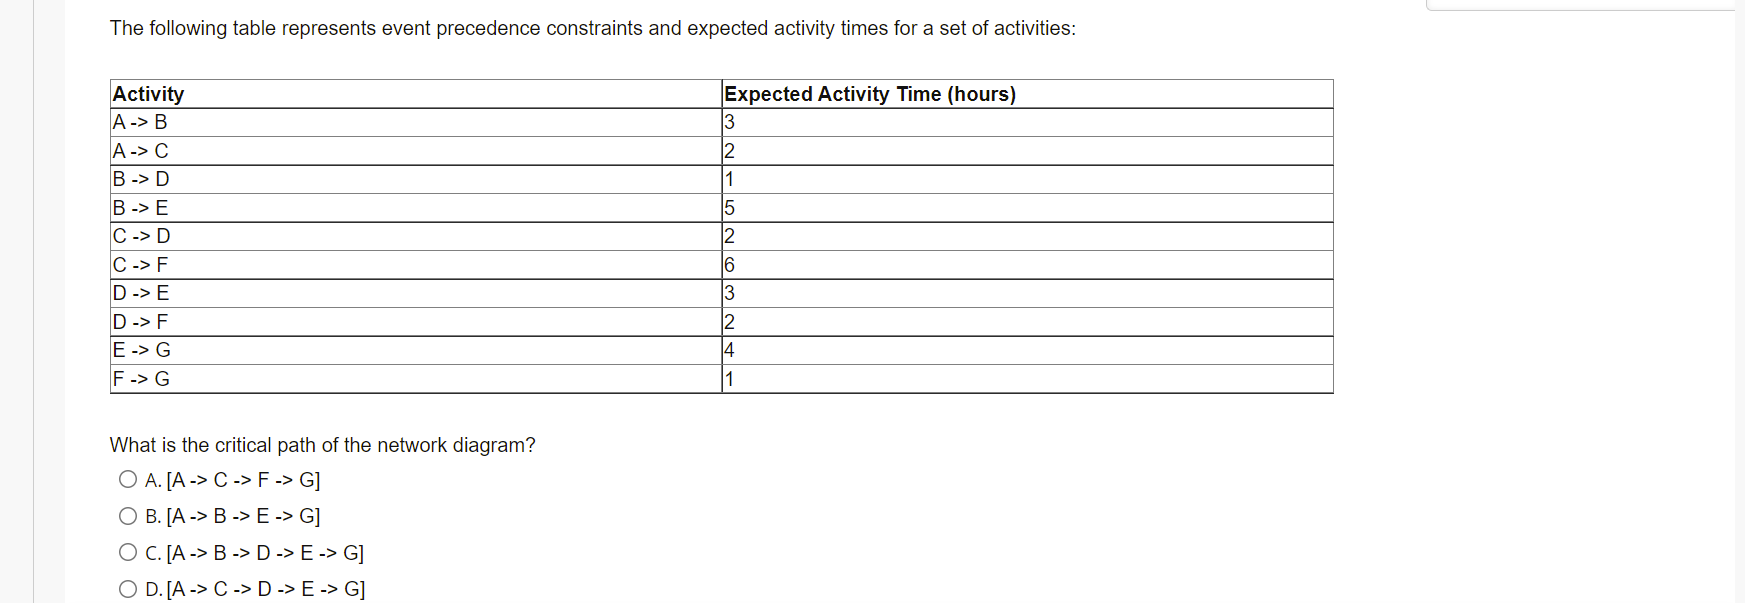
The following table represents event precedence constraints and expected activity times for a set of activities: Activity A-> B A-> C B -> D Expected Activity Time (hours) 3 2 B -> E C -> D C -> F D -> E D -> F E -> G F-> G What is the critical path of the network diagram? O A. [A -> C -> F -> G] OB. [A > B > E-> G] O C. [A -> B > D -> E -> G] O D. [A -> C -> D-> E -> G] |1 5 2 6 3 2 4 1
Step by Step Solution
There are 3 Steps involved in it
1 Expert Approved Answer
Step: 1 Unlock

Question Has Been Solved by an Expert!
Get step-by-step solutions from verified subject matter experts
Step: 2 Unlock
Step: 3 Unlock